Download
1 / 31
310 likes | 456 Views
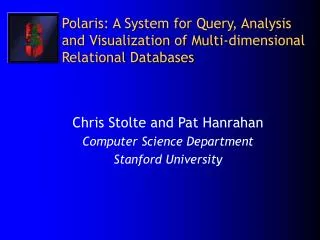
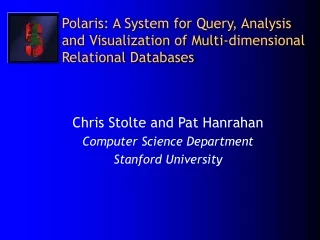
Polaris Query, Analysis, and Visualization of Large Hierarchical Relational Databases. Pat Hanrahan With Chris Stolte and Diane Tang Computer Science Department Stanford University. Motivation. Large databases have become very common Corporate data warehouses Amazon, Walmart,…

E N D
PolarisQuery, Analysis, and Visualization of Large Hierarchical Relational Databases Pat Hanrahan With Chris Stolte and Diane Tang Computer Science Department Stanford University
Motivation • Large databases have become very common • Corporate data warehouses • Amazon, Walmart,… • Scientific projects: • Human Genome Project • Sloan Digital Sky Survey • Need tools to extract meaning from these databases
Related Work • Formalisms for graphics • Bertin’s “Semiology of Graphics” • Mackinlay’s APT • Roth et al.’s Sage and SageBrush • Wilkinson’s “Grammar of Graphics” • Visual exploration of databases • DeVise • DataSplash/Tioga-2 • Visualization and data mining • SGI’s MineSet • IBM’s Diamond
Polaris Formalism • UI interpreted as visual specification that defines: • Table configuration • Type of graphic in each pane • Encoding of data as visual properties of marks • Data transformations and queries
Schema Market State Year Quarter Month Product Type Product Profit Sales Payroll Marketing Inventory Margin COGS ... Ordinal fields (categorical) Coffee chain data[Visual Insights] Quantitative fields (measures)
Polaris Visual Encodings Principle of Importance Ordering: Encode the most important information in the most effective way [Cleveland & McGill]
The Pivot Table Interface • Common interface to statistical packages/Excel • Cross-tabulations • Simple interface based on drag-and-drop
Data Cubes • Structure relation as n-dimensional cube Each cell aggregatesall measures for those dimensions Each cube axis corresponds to a dimension in the relation
Table Algebra: Operands • Ordinal fields: interpret domain as a set that partitions table into rows and columns: • Quarter = {(Qtr1),(Qtr2),(Qtr3),(Qtr4)} • Quantitative fields: treat domain as single element set and encode spatially as axes: • Profit = {(Profit)}
Concatenation (+) Operator • Ordered union of two sets • Quarter + ProductType • = {(Qtr1),(Qtr2),(Qtr3),(Qtr4)}+{(Coffee),(Espresso)} • = {(Qtr1),(Qtr2),(Qtr3),(Qtr4),(Coffee),(Espresso)} • Profit + Sales • = {(Profit),(Sales)}
Cross () Operator • Direct-product of two sets • Quarter ProductType = • {(Qtr1,Coffee), (Qtr1, Tea), (Qtr2, Coffee), (Qtr2, Tea), • (Qtr3, Coffee), (Qtr3, Tea), (Qtr4, Coffee), (Qtr4,Tea)} • ProductType Profit =
SQL Dataflow • Notes • Aggregation operators applied after sort • Only one layer is shown; additional z-sort Sort Relational Table Tuples in Panes Marks in Panes
Hierarchical Structure • Challenge: these databases are very large • Queries/Vis should not require all the records • Augment database with hierarchical structure • Provide meaningful levels of abstraction • Derived from domain or clustering • Provides metadata (missing data for context)
Hierarchies and Data Cubes • Each dimension in the cube is structured as a tree • Each level in tree corresponds to level of detail
Schema: Star Schema Existence Table Fact table Location Market State State Month Product Profit Sales Payroll Marketing Inventory Margin ... Time Year Quarter Month Products Product Type Product Name Measures • Generalizations • Snowflake schemas • Lattices (DAGs)
Categorical Hierarchies • Quarter Month • Direct product of two sets • Would create twelve entries for each quarter, i.e. (Qtr1, December) • Quarter / Month • Based on tuples in database not semantics • Would only create three entries per quarter • Can be expensive to compute • Quarter . Month • Based on tuples in existence tables (not db)
Cartographic Generalization Canterbury and East Kent 1:50,000 1:625,000
Generalization: Techniques • Selection • Simplification • Exaggeration • Regularization • Displacement • Aggregation
Summary • Polaris • Spreadsheet or table-based displays • Simple drag-and-drop interface • Built on a formalism that allows algebraic manipulation of visual mapping of tuples to marks • Multiscale visualizations using data and visual abstraction • Connects to SQL/MDX servers • Seehttp://www.graphics.stanford.edu/projects/polaris
Future Work • Articulate full-set of multiscale design patterns • Transition between levels of detail • Develop system infrastructure for browsing VLDB • Support layers/lenses/linking with tuple flow • Device independence through graphical encodings • Extend formalism to 3D • Couple scientific and information visualization • …