Download

1 / 13
130 likes | 253 Views
Modeling Real-life Phenomenon. 3 Real –life phenomenon that can be modeled using different graphs. Beatrice Hecht. Studying data . Data can reveal trends in real-life situatiions . Trends can help us understand the world around us and how it is changing.

E N D
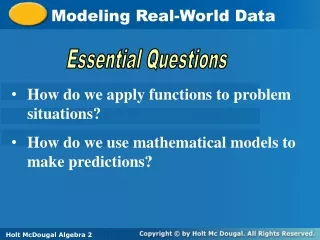
Modeling Real-life Phenomenon • 3 Real –life phenomenon that can be modeled using different graphs Beatrice Hecht
Studying data • Data can reveal trends in real-life situatiions. • Trends can help us understand the world around us and how it is changing. • Trends can also help us to predict future conditions • Graphing data and finding a model to fit the data allows us to visualize and extrapolate from the given to the future.
Population data • Population data can be studied in many ways. • We can plot the data showing the population of a city or country and determine the trends in the growth or decay of that population • I have chosen to study data showing population growth by the billions – when population grew by another billion. • This will not produce an exponential growth model!
World Population Growth, in Billions Number of years to add each billion (year) All of Human History (1800) 130 (1930) 30 (1960) 15 (1975) 12 (1987) 12 (1999) 14 (2013) 14 (2027) 21 (2048) Sources: First and second billion: Population Reference Bureau. Third through ninth billion: United Nations, World Population Prospects: The 2004 Revision (medium scenario), 2005.
Population growth by the billions As you can see, the bar graph implies a model would best fit the data which is concave up, decreases but then increases. I ruled out exponential, logarithmic, power and linear functions since they would continue to decrease only. I ruled out a cubic model since it would decrease, then increase, but then decrease again. That left a quadratic or quarticmodel…
Population growth by the billions • The quadratic fit was good, with r^2 = .7870109468 • However, the quartic fit was even better, with r^2 = .9914948175 ! • In order to create these regression equations I needed to discard the first piece of data because it did not indicate change from a previous population. • The model for predicting when population increases by a billion is: • f(x) = .5814x^4-14.4987x^3+131.5852x^2-512.9060x+734.5595 where x represents the number of years since 1880.
Next I studied world population growth • Guess what the graph of world population looks like!! Bet you were wrong!!!
Population growth Annual increase in world population (millions)
Population growth • If we look at the graph for the world’s population growth (in millions of people), we see a surprising graph. • It appears to be a graph that would best be fit by a sixth degree polynomial model. • What could be causing the decreases in the population in the 1970s and recently? • China has put strict limits on the number of offspring – ONE – per couple. Since China has the world’s largest population, and one child per couple would cause an eventual decrease in population, this would account for the recent decline in population worldwide, along with easier access to birth control in third world countries.
Finally I looked at a graph of “women of child-bearing age. • This is a graph of the number of women ages 15 to 49
Women of Childbearing age Number of women 15 to 49 (billions)
Women of Childbearing Age • What model should be chosen for this data? • While the model of best fit is quartic with r^2 = .999873, this would imply that the population of women of childbearing age would continue to increase rapidly in the future. • Based on the previous model for overall population growth, it is more likely that the population of women of childbearing age would level off along with a decline in population. • Therefore it seems the model of best fit would be a logistic model: • f(x) = 2.240697388 / (1+ 20.2105007e^(=.0379252879x))
Fitting models to data • So, I have presented data that can be modeled by a quartic equation, a sixth degree polynomial equation and a logistic equation. • Many possible models can be used to represent the data, but I chose the model which made the most sense given the real-life situation/phenomenon being presented by the data.