Download
1 / 18
180 likes | 280 Views
NSGIC 2010 Broadband Session. Presenters and Presentations. Jim Schriever and Sudha Maheshwari (Sanborn) – Lessons and Experiences in Several States Jon Gottsegen (CO) – “Tiny Bubbles”: Colorado’s Process for Identifying Areas Served by Broadband

E N D
Presenters and Presentations • Jim Schriever and Sudha Maheshwari (Sanborn) – Lessons and Experiences in Several States • Jon Gottsegen (CO) – “Tiny Bubbles”: Colorado’s Process for Identifying Areas Served by Broadband • Barney Krucoff (DC) - Working With Data from the FCC Form 477, Benefits and Pitfalls • Bill Johnson (NY) - Partnering with Providers: Lessons Learned in NY • Bert Granberg (UT) - Broadband Verification, Space & Frontiers • Dan Widner (VA) – Virginia’s Broadband Mapping Efforts • Dave Brotzman (VT) – “Can You Hear Me Now” Drive Test Verification in VT
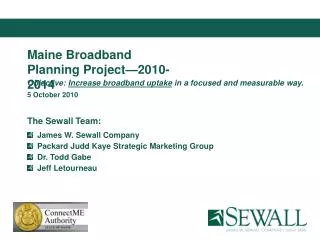
“Can You Hear Me Now”Drive Testing For Verification In Vermont Dave Brotzman VT Center For Geographic Information
Why Drive Test? • Mobile Cellular network data performance difficult to model • Throughput loosely correlates with RF signal strength (above minimum threshold) • User throughput impacted by many factors including: • Radio network technology and deployment settings • Radio network capacity and interference levels • Available network backhaul • Internet protocol overhead and network congestion • Best measure of user throughput is obtained from actual mobile devices • Limitations in VT • WISP coverage difficult to measure due to proprietary technology/access and point-to-point deployments
What We Asked For • Test All Mobile Wireless Providers - Data and Voice • Drive All Federal Aid Roads In VT ~3500 mi. • Test Provider Service as Often as Possible • Provide Connection Data, Transceiver Locations and Maps *************************************** • We’ve Only Had the Data About 2 Weeks • Preliminary Assessment
What Was Collected • Voice call success/fail • Data call success/fail and high level data transfer summary • Uplink data speeds • Downlink data speeds • Received signal strength indications (RSSI) • Network used (shows where the phone was roaming for AT&T/T-Mobile) • Network type (indicates min/max voice and data services supported) • Serving cell information: CellID for AT&T/T-Mobile, serving cell location (lat/long) for Sprint and USC and a few locations for Verizon • Neighbor cell lists (identifier, channel, RSSI for all of the neighbor sites that the mobile phone could hear). • Band/channel used information – identifies the frequency band used.
Burlington Data Example Carrier Provided Data Coverage Measured Downlink Speed >= 768 kbps Measured Downlink Speed < 768 kbps Many test locations don’t meet NTIA Broadband Data speed criteria
Final Statistics • This Required a Significant Effort - Cost • 11 full days of driving (5/31-6/10) • 14.5 hours testing per day (average). • 12 hrs min, 16.5 hrs max • 5020 total miles driven • 2.7 GB of collected data • 0 speeding tickets 90 mi 150 mi 9660 sq.mi.
What We’re Finding (Preliminary) • Drive Testing is Realistically Most feasible For; • Small States • Very Contentious or High Value Areas • Good Correlation With Provider’s Coverage Data • Low Percentage of Connections With Service Levels =/> NTIA Broadband Speed Definition • Max Advertised Speed vsAverage Speed • Not Sure Yet How We Will Represent These Findings To NTIA or The Public – Suggestions Welcome
Thanks To:Steve Sharp – Project Lead/NTIA Grant - VCGI Bryan Petch - Pericle Communications Co.