Download
1 / 12
120 likes | 222 Views
Edge Neutral Density (ENDD) Diagnostic Overview. Patrick Ross. Monday, March19, 2007. Monday Physics Meeting. Beam Power Loss Scan with Varied Edge Neutral Density in TRANSP. Shot 120442. 10 12 cm -3.

E N D
Edge Neutral Density (ENDD) Diagnostic Overview Patrick Ross Monday, March19, 2007 Monday Physics Meeting
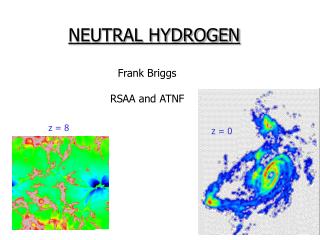
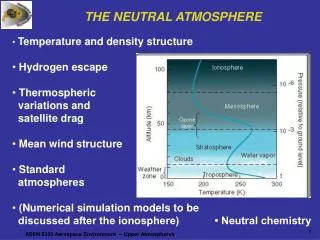
Beam Power Loss Scan with Varied Edge Neutral Density in TRANSP Shot 120442 1012 cm-3 As the edge neutral density is increased from 1010 cm-3 to 1012 cm-3, the fraction of beam power lost charge exchange outside the plasma increases from less than one percent to nearly 15%. This will have a significant impact in the overall understanding of power balance and heating in NSTX. 1011 cm-3 1010 cm-3 Total lost power from the neutral beams due to charge exchange outside of the plasma. As the neutral density in the edge is increased, the lost beam power increases to approximately 15% of the total beam power.
Profile of Edge Neutrals Purpose of Diagnostic: To measure the absolute neutral particle density profile at the outer midplane Motivation: Edge neutral density is a major uncertainty in fast ion loss due to charge exchange. Several other diagnostics rely upon the edge neutrals for their measurements. Currently estimates are used or else a flat profile is assumed. This diagnostic will also be useful in the analysis of H-modes. It will also help measure the effect of Lithium coating.
Description of ENDD diagnostic • Operation of the ENDD diagnostic • Tangential View of the plasma is used to get an image of the plasma Dβemission. Data is stored in the MDSplus tree in the 'cameras' node. • One row of pixels is taken from the image and Abel-inverted (using algorithm written by R.Bell) to obtain an emission profile • Thomson scattering data is used as input into a collisional-radiative model • This yields a neutral density profile
Method for Measuring the Edge Neutral Density Profile 1. Measure the absolute emissions from atomic hydrogen using an Dβ filter, subtracting out the background. • Dα emission would let in more light, but is too near a carbon emission line and would saturate the camera. 2. Obtain ne and Te from Thomson scattering. This data is necessary for the collisional-radiative model to determine the absolute density of neutral hydrogen. 3. Abel-invert the camera image to obtain the emission intensity as a function of major radius. 4. Using the Einstein coefficient (A24) and emission intensity (I), determine the density of the n=4 excited state of hydrogen (n4) using I= A24*n4 5. Spline the ne and Te data onto a table containing the population ratio coefficient (n4/ n0) obtained from D.Stotler, comparing the population fo the n=4 state to the ground state. 6. Determine the absolute density n0 by n0= n4/ (n4/ n0) at each pixel of the camera, giving a profile of the edge neutral density.
Calibration of the ENDD diagnostic • A whiteplate was used for in-vessel photometric calibration. This was done to take into account the geometric properties of the view (vignetting due to the mirror and the edge of the bay) • The whiteplate was calibrated out of the vessel using a Labsphere source and the camera. • The spatial calibration was performed using the Faro arm to measure two planar surfaces in the camera field of view. The minimum radius of each pixel line of sight was calculated using these surfaces.
Viewable Range: 145-160 cm Beam armor Firetip LOS Mirror Camera
Camera captures the entire discharge: 122537 160 cm 147 cm
Status of view Shot: 122537 Time = 360 ms Outer separatrix=150 cm Max TS data= 156 cm The separatrix is just barely included in the picture. If the camera is adjusted, it may be able to see farther into the plasma. New TS points may be useful for outer analysis. New filter may be necessary. Current filter has FWHM of 1.5 nm (~7°) Separatrix 160 cm 147cm 150 Inboard Outboard
Preliminary Results of the Absolute Neutral Hydrogen Density The profile exhibits the expected behavior. The center of the plasma contains the lowest density, with increasing density toward the outside. However, it is not yet clear if the steep increase is due to a real effect or if it is an artifact of the inversion matrix or some other effect.
Time evolution of Neutral Density in 2006 T=0.233 s T=0.166 s T=0.200 s T=0.133 s T=0.233-0.400s T=0.200-0.266s RF shot 121539. This plot shows the neutral density at different time slices from time=0.133-0.266 s. The density drops with consecutive time slices, though it appears to be stablizing by around 0.200 s. This could be a sign of the neutral density reaching an equilibrium. Beam shot 121534. Although the initial absolute neutral density is approximately equal to that in RF shots, the equilibrium value in beam shots appears to be about half of that in RF shots. Both shots initially have a large edge neutral density, which quickly decreases to a stable value
Conclusions / Continuing work • Images currently stored in the tree • cameras2::top.edge_neutral • Analysis limited by Thomson Scattering Data • Few points at the edge of the plasma • Max TS radius = 156 cm • Analysis limited by Thomson Scattering Data • Analysis will be completed and available soon: • http://www.pppl.gov/~pwross/endd.html • Obtain a filter with a larger FWHM • Camera will be moved so the outer edge corresponds to the edge of Thomson Scattering data (2008 run year) • Should provide more inboard data, well into the plasma. Useful for plasmas with larger outer gap