Download
1 / 36
360 likes | 367 Views
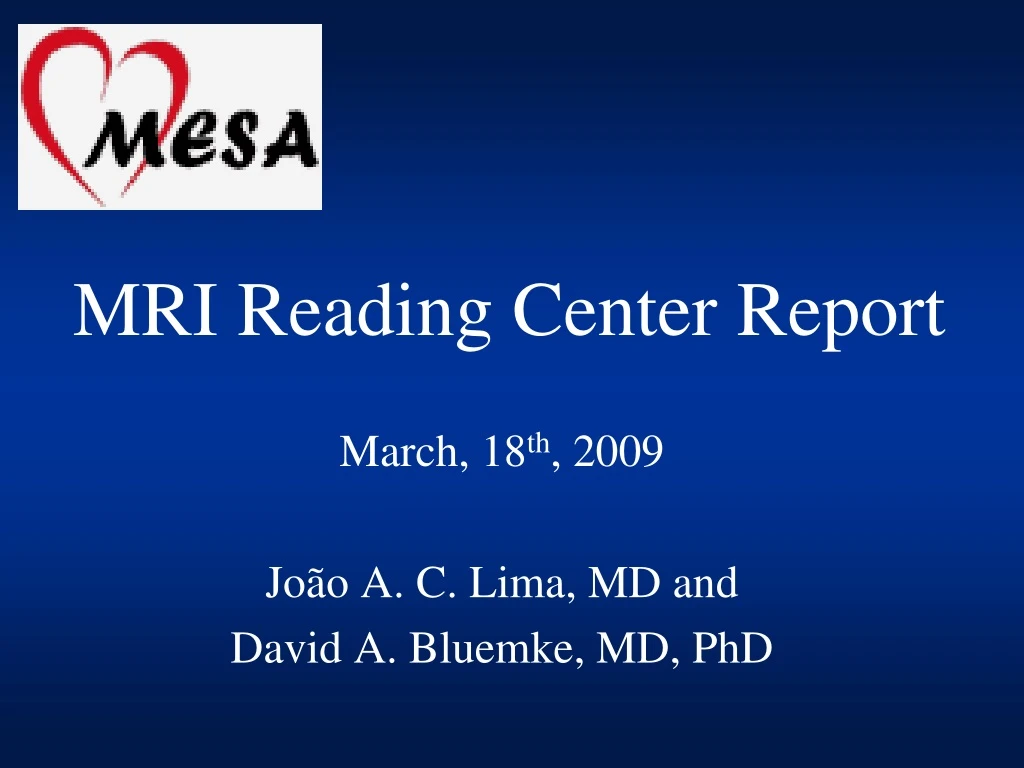
MRI Reading Center Report. March, 18 th , 2009 João A. C. Lima, MD and David A. Bluemke , MD, PhD. MESA MRI JHU READING CENTER. Co-PIs: Jo ã o A. Lima, MD and David A. Bluemke , MD PhD QC/ Planning: Chia -Ying Liu, PhD MRI Database: John Eng, MD

E N D
MRI Reading Center Report March, 18th, 2009 João A. C. Lima, MD and David A. Bluemke, MD, PhD
MESA MRI JHU READING CENTER Co-PIs: João A. Lima, MD and David A. Bluemke, MD PhD QC/ Planning: Chia-Ying Liu, PhD MRI Database: John Eng, MD MR Research Program Manager: Erin Ricketts, MSPH Core Variables (PA and Ob): EvrimBengi-Turkbey, MD Core Variables (Analysis): Ellen Stengel, RDCS Ancillary data, cMRA: Cuilian Miao, MD MRI tagging: Ray Yan, MD, Ela, Chamera, RDCS MondaShehata, MD, S. Berkowitz Aortic Distensibility: Alban Redheuil, MD RV Function Aditya Jain, MD, HarjitChahal, MD
MESA MRI RC Components(anticipated times) • Core Variables – LV Mass, LV Volumes, EF (10 minutes) • MRI Tagging (15 minutes) • Delayed Enhancement (15 minutes) • Aortic Stiffness (5 minutes)
Average Scan Time per Exam -EDIC (C. Liu, C. Miao, Eng J, D Bluemke)
MESA MRI RC Activities • LV mean and volumes (reproducibility) • 50 GE • 50 Siemens • MR LVM and volume reads, MESA 4 (N=560) • MRI Tagging • Recruitment – tagging vs. STE - JHU • Analysis – N=1,046 • Software development • Reproducibility
MESA MRI RC Activities • MESA RV • N=4,000 • Aortic stiffness (data analysis) • Delayed Enhancement (sample size planning)
Fig. 2. Adjustment for systematic differences. corrected (MESA II) uncorrected (MESA I) technical correction (MESA II – I) reading correction (MESA II – I) = + + Eng J, Bluemke D, Wu C
Fig. 1. Sources of variability. participant physiological variability (5%) heart rate respiratory motion positioning site* (2–12%)? images technical variability pulse sequence† (5–15%) scanner type** (1.5–3%) site* (2–12%)? measurements reading variability inter-reader†† (6%) intra-reader†† (6%) analysis software image display Sources of estimates: * Johnson 2007 † Malayeri 2008 ** J. Eng extension of statistical analysis in Johnson 2007 †† Natori 2006 Eng J, Bluemke D, Wu C
MR Tagging in MESA: Progress Update and Reproducibility Seth Berkowitz, Raymond Yan, Colin Wu, Joao A Lima, David A Bluemke Department of Radiology and Medicine, Johns Hopkins School of Medicine, Baltimore, Maryland
Inter/Intra-observer Reproducibility • Previous study on reproducibility of HARP analysis in MESA: • 24 MESA participants. Columbia, JHU, Minnesota, UCLA • Three independent observers • Castillo, et al. (2005)'Quantitative Assessment of Regional Myocardial Function with MR Tagging in a Multi-Center Study: Interobserver and Intraobserver Agreement of Fast Strain Analysis with Harmonic Phase (HARP) MRI',Journal of Cardiovascular Magnetic Resonance,7:5,783 — 791
Reproducibility is defined as inter-exam difference in Ecc of <3% -- within 15% of the observed variation in Ecc (20%) across the MESA tagging ancillary study population Inter-exam Differences in Regional Strain Among 11 MESA Participants
Slice Orientation Effects 2 healthy volunteers - 3 slices of tagging Same slices repeated Temporal resolution changed Tagging planes rotated out of true short axis +/- 15° Participant moved in magnet, planes re-acquired Objective was to study effects of slice variations on strain measurements
Conclusions Ongoing analysis of tagging studies in Exam 4 Strain measurements (Ecc) are highly reproducible across examinations and readers Strain data are robust to variations in slice prescription
Scar Imaging by Magnetic Resonance ImagingEpidemiology of Diabetes Interventions and Complications (EDIC) Study Evrim B. Turkbey, MD David A Bluemke, MD PhD Radiology and Imaging Sciences, National Institutes of Health/ Clinical Center Johns Hopkins University
DE-MRI can detect Q wave and non-Q wave myocardial infarctions and can better estimate the true prevalence of unrecognized myocardial infarction and its association with major cardiac events Rationale for delayed enhancement MRI
**Hunold P. et al Myocardial late enhancement in contrast-enhanced cardiac MRI: distinction between infarction scar and non-infarction-related disease. AJR 2005; 184:1420-26 E. Unrecognized Myocardial Scar Delayed Enhancement (Scar) Patterns ISCHEMIC NONISCHEMIC A.Transmural Infarct B.Subendicardial infarct C. Mid-wall HE D. Epicardial HE
Prevalence of Scar • Barbier CE et al. (n=248, mean age= 70 years) • 20% of subjects had unrecognized myocardial infarcts (n=49) • 6.1% of them had Q waves (n=3) • The prevalence of unrecognized myocardial infarction was greater than earlier estimates with ECG • Kwong RY et al. ( 107 diabetic patients with a clinical suspicion of coronary artery disease, mean age= 60 years) • 28% had unrecognized myocardial scar (n=30) • DE by CMR was found to be associated with a significant risk of major adverse cardiovascular events, which may provide additional prognostic information beyond clinical and LV function variables **Barbier CE et al. J Am Coll Cardiol 2006;48:765-71. ** Kwong RY et al. Circulation. 2008;118:1011-20.
Gadolinium Exclusions • MRI has been performed since September 2007 • N= 1178 eligible participants • N=1055 consented to MRI • N= 234 excluded from gadolinium administration (25%) • N=199 GFR related (18.9%) • N = 167 past or present GFR < 60 (71.4%) • N = 6 allergic (2.6%) • N = 2 dialysis (.9%) • N = 9 transplant (3.8%) • N = 15 other (6.4%) • N=52 refuse gad (6.1%, 52/(1055-199))
Who should be sampled in MESA 5? • Sample size: 25% of MESA 5 participants (~1200) • Random sample • Targeted sample • Participants with high calcium scores • Participants with high left ventricular mass • Participants who had longitudinal follow up • Mixed sample • Targeted (3/4)+ random sample (1/4)
Aortic Functionin MESA Alban REDHEUIL, Raymond YAN, Wen-Chung YU, David BLUEMKE, Joao LIMA Department of Cardiology and Radiology Johns Hopkins School of Medicine, Baltimore, Maryland University of Paris, René Descartes School of Medicine and INSERM U678, Paris, France
Thoracic Aorta Imaging Introduction Function Structure • Distensibility • Pulse wave velocity • Wall thickness • Calcifications Alban Redheuil
Distensibility AD= ΔA/A PP from Laurent S. EHJ 2006
Pulse Wave Velocity From S. Laurent EHJ 2006 Alban Redheuil
Aortic PWv in MRI PWv = ∆d ∆t Alban Redheuil
Velocity Encoding: Phase Contrast Alban Redheuil
MRI Protocol Planning + Acquisition times • Axial scout: 40s • … … • … … • 3 sagittal oblique slices on the aortic arch: 3x30s • 1 axial perpendicular to the aorta black blood: 30s • 1 PC axial perpendicular to the aorta: 40s • … … • … … Total: ~5 min
MRI Protocol Analysis times • Aortic Distensibility 10 min • PWv 20 min • Aortic length measurement 5 min • Pulse wave time measurement 15 min Total: ~30 min Not including image management times ++
Why Pulse Wave Velocity ? • The most simple, non invasive, robust and reproducible method to determine arterial stiffness • Direct measure of aortic stiffness and aging • PWv has been used in the epidemiological studies demonstrating the predictive value of aortic stiffness for CV events over traditional CVRF • Shokawa (2005): CV mortality in the general population • Willum-Hansen (2006): CV mortality in the general population • Sutton-Tyrell (2005): CV mortality, CHD, Stroke in older adults • Surrogate endpoint? Alban Redheuil
Ancillary PWv Study in MESA • Goal: 500-600 by summer 2009 • Relationship to regional myocardial Strain - N based on overlap MESA1 / MESA 4 tagging cases • Relationship to ventricular remodeling and mass • Relationship to CV risk factors
Available MRI Aortic Distensibility in MESA at baseline 6814 • Transfer of the velocity images • Unavailable VENC value • Unavailable PP during MRI • Image quality issues (mvt) 5004 MRI MESA 1 (2,3) 4678 w/PC ∆: 1327 3677 w/AD Alban Redheuil