Download
1 / 34
350 likes | 521 Views
Vibrational Spectroscopy for Pharmaceutical Analysis. Part II. Introduction to Applications and Theory. Rodolfo J. Romañach, Ph.D. Spectroscopy. Spectroscopy – is the study of the interaction between radiation and matter.

E N D
Vibrational Spectroscopy for Pharmaceutical Analysis Part II. Introduction to Applications and Theory. Rodolfo J. Romañach, Ph.D.
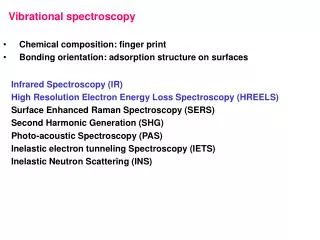
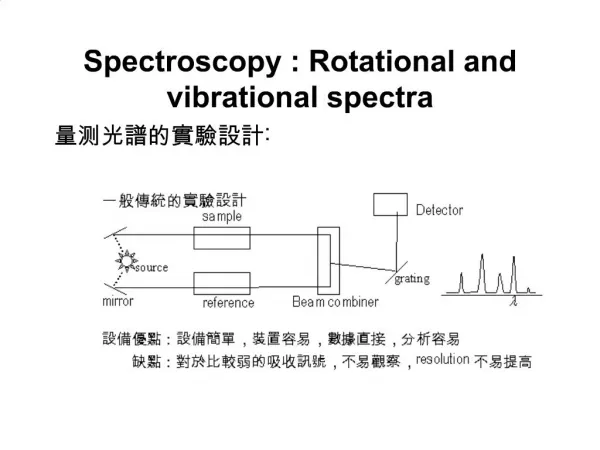
Spectroscopy • Spectroscopy – is the study of the interaction between radiation and matter. • In spectroscopy the absorption or reflection of radiation by matter (solids, liquids, gases) is studied. • Spectroscopists study the interaction of radiation with practically the entire electromagnetic spectrum.
Electromagnetic Spectrum 12,500 cm-1 (800 nm) 4,000 cm -1 (2500 nm) Frequency (cm-1) -Ray X – Ray Ultraviolet visible NIR MIR FIR ESR NMR Region Infrared Microwave Radio, TV Waves NuclearTransitions InnerShell Electronic Transitions ValanceElectron Transitions MolecularVibrations MolecularRotations SpinOrientation in MagneticField Interaction Wavelength (m) Slide Courtesy Bruker Optics
Spectroscopy Provides Structural Information The various spectroscopic techniques provide information such as: • Presence of functional groups. • Differences in the crystal structure of compounds. • Presence of elements (Fe, Ni, Pb) in a sample.
Modules Cover • Mid-infrared spectroscopy. • Near infrared spectroscopy. • Raman spectroscopy There are many other spectroscopic used in other in analytical chemistry and materials science.
Mid-IR Spectroscopy Widely Used in: • Identification of Pharmaceutical Raw Materials and Finished Products. Principal method of material identification in a pharmaceutical manufacturing company. • Combination with MS and NMR to determine structure of process impurities and degradation products. • Characterization of natural products, use of GC/FT-IR. • Forensic Analysis, IR-Microscopy. • Environmental Analysis: GC/FT-IR. • Surface Analysis, Diffuse Reflectance, Attenuated Total Reflectance, Grazing Angle. • Studies of Protein Structure and Dynamics.
Units in IR Spectroscopy • Mid-infrared range, wavelength is 2.5 – 25 μm. Equivalent to 4000 – 400 cm-1. • The cm-1 are termed wavenumbers or reciprocal centimeters, not frequency (ν). Wavenumber is the number of waves in a 1 cm wavetrain. • Frequency is number of complete waves in each second. • Wavenumber = ν/c = 1/λ
Units of spectra- nm, m, cm-1 Sometimes see cm-1 : • 10,000 cm-1 = (1/10,000) cm or 0.0001 cm = 1 m = 1000 nm • 6,000 cm-1 = (1/6000) cm or 0.000167cm=1.67m = 1670 nm • 5,000 cm-1 = (1/5000) cm or 0.0002 cm = 2m = 2000 nm • 4000 cm-1 = (1/4000) cm or 0.00025 cm = 2.5 m = 2500 nm.
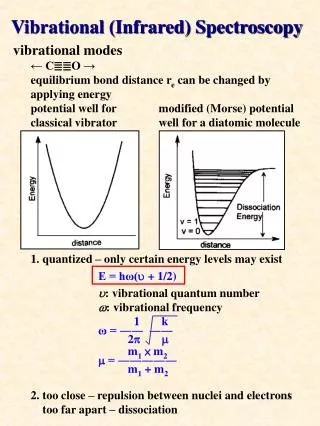
Vibration Theory The molecule can be thought of as mass m1 and m2 connected by a spring. At equilibrium, the distance between the two masses is r0. If the molecule is stretched by an amount r = x1 + x2, then a restoring force, F, is produced. If the spring is released, the system will vibrate around the equilibrium position. According to Hooke’s Law, for small deflections the restoring force is proportional to the deflection: F = -k . r Since the force acts in a direction opposite to the deflection, the proportionality constant, or force constant, k, is negative in sign. The force constant is called the spring constant in the mechanical model, whereas in a molecule the force constant is a measure of the bond strengthbetween the atoms. Courtesy Bruker Optics
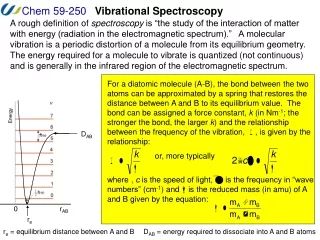
( ) 1/2 1 k m 2pc Molecular Vibrations M M 1 2 Simple harmonic oscillator: n = For a simple harmonic oscillator it is possible to calculate the vibrational frequency, , of a diatomic molecule as follows: n -vibrational frequency in wavenumber k - vibrational force constant c - speed of light m - reduced mass = m1 m2 /(m1+m2) Slide Courtesy Bruker Optics
~ Vibration Theory On the basis of the equation above it is possible to state the following: 1) The higher the force constant k, i.e., the bond strength, the higher the vibrational frequency (in wavenumbers). 3 absorption peaks for different force constants. Note that by convention, in infrared spectroscopy wavenumbers are plotted right-to-left; i.e., highest wavenumber to the left. Slide Courtesy Bruker Optics
Vibration Theory 2) The larger the vibrating atomic mass, the lower the vibrational frequency in wavenumbers. 3 absorption peaks for different atomic masses. Note that by convention, in infrared spectroscopy wavenumbers are plotted right-to-left; i.e., highest wavenumber to the left. Slide Courtesy Bruker Optics
Vibration Theory For the harmonic oscillator model, the potential energy well is symmetric. According to quantum-mechanical principles molecular vibrations can only occur at discrete, equally spaced, vibrational levels, where the energy of the vibration is given by: Ev=(v + ½) h v = 0, 1, 2, 3, ... Where h is Planck’s constant and v is the vibrational quantum number. Even in case of v = 0, which is defined as the ground vibrational level, a molecule does vibrate: Ev= ½ h Potential energy curve for a harmonic oscillator Based on Bruker Optics Slide
When absorption occurs, the molecule acquires a clearly defined amount of energy, (E = h ), from the radiation and moves up to the next vibrational level (v = +1). For a harmonic oscillator, the only transitions permitted by quantum mechanics are up or down to the next vibrational level (v = 1). Vibration Theory If the molecule moves down to the next vibrational level (v = -1), a certain amount of energy is emitted in the form of radiation. This is called emission. Based on Bruker Optics Slide
A Molecule Absorbs Infrared Energy when: • A vibration occurs where the dipole moment of the molecule changes, and the molecule is illuminated with radiation equal to the frequency of vibration.
- + - + - + Change in Dipole Moment during Molecular Vibrations • Must change for IR absorption to occur. • The dipole moment is a measure of the degree of polarity of molecule (magnitude of the separated charges times the distance between them). • A measurement of degree of unequal distribution of charges in molecule. H Cl
Band Intensity in IR • Band intensity depends on the rate of change of dipole moment during absorption of IR light. • Stronger bands occur when the change in dipole moment is greatest.
A Mid-Infrared Spectrum • A spectrum is a plot that shows the absorption or reflection of radiation as wavelength or frequency of the radiation is varied.
USP on Mid-IR Spectrosopy The Unites States Pharmacopeia indicates: “The IR spectrum is unique for any given chemical compound with the exception of optical isomers, which have identical spectra. However, polymorphism may occasionally be responsible for a difference in the IR spectrum of a given compound in the solid state.” USP section 851, “Spectrophotometry and Light Scattering”
211.84 Testing and approval or rejection of components, drug product containers, and closures. • (d) Samples shall be examined and tested as follows: • (1) At least one test shall be conducted to verify the identity of each component of a drug product. Specific identity tests, if they exist, shall be used. • (2) Each component shall be tested for conformity with all appropriate written specifications for purity, strength, and quality. In lieu of such testing by the manufacturer, a report of analysis may be accepted from the supplier of a component, provided that at least one specific identity test is conducted on such component by the manufacturer, and provided that the manufacturer establishes the reliability of the supplier's analyses through appropriate validation of the supplier's test results at appropriate intervals.
Group Frequencies • Characteristic of functional groups such as -O-H, -CH3, -COCH3, and COOH. • Determined empirically by studying the spectra of many related molecules. • Always found in the spectrum of a molecule containing that group, and always occurs in the same narrow frequency range. • The form of the bands is nearly always the same in every molecule containing that group.
Fingerprint Frequencies • Highly Characteristic of the Specific Molecule. • Due to Vibrations of the Molecule as a whole. • The numerical values cannot be predicted in most cases. • Valuable in characterizing a molecule. • Fingerprint region is useful for discriminating between molecules that resemble each other.
Dividing Line • 1500 cm-1 dividing line: above 1500 cm-1 if a band has a reasonable intensity, it is a group frequency. • Below 1500 cm-1 the band may be either a group or fingerprint frequency. • Below 1500 cm-1 called the fingerprint region.
IR Spectroscopy • Excellent in identification. • Every compound has a unique IR spectrum. • Better than a fingerprint, provides structural information. • Helps in completing the “structure puzzle” when coupled with NMR, and MS (Detection of Compounds vs. Obtaining Structural Information).
FINGERPRINT FREQUENCIES HIGHLY USEFUL TO DISCRIMINATE BETWEEN MOLECULES THAT RESEMBLE EACH OTHER.
Identity Test in Pharmaceutical Manufacturing • In an identity test at a pharmaceutical manufacturing site, an analyst would compare the spectrum of the material to be used in production with that of a reference standard.
Typical Identification in Pharmaceutical Industry with Mid-Infrared Spectroscopy