Download
1 / 69
690 likes | 847 Views
Microarray preprocessing and quality assessment Wolfgang Huber European Bioinformatics Institute . H. Sueltmann DKFZ/MGA. log-ratio. Which genes are differentially transcribed?. same-same. tumor-normal. log feature intensity (a.u.). arrays, colour channels. PCR plates.

E N D
Microarray preprocessing and quality assessment Wolfgang Huber European Bioinformatics Institute H. Sueltmann DKFZ/MGA
log-ratio Which genes are differentially transcribed? same-same tumor-normal
log feature intensity (a.u.) arrays, colour channels
PCR plates Scatterplot, colored by PCR-plate Two RZPD Unigene II filters (cDNA nylon membranes)
print-tip effects F(q) q (log-ratio)
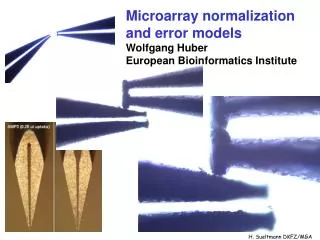
spotting pin quality decline after delivery of 5x10⁵ spots after delivery of 3x10⁵ spots H. Sueltmann DKFZ/MGA
spatial effects R Rb R-Rbcolor scale by rank another array: print-tip color scale ~ log(G) color scale ~ rank(G) spotted cDNA arrays, Stanford-type
Batches: array to array differences dij = mediank |hik -hjk| arrays i=1…63; roughly sorted by time
A complex measurement process lies between mRNA concentrations and intensities The problem is less that these steps are ‘not perfect’; it is that they vary from array to array, experiment to experiment.
Statistics 101: biasaccuracy precision variance
Basic dogma of data analysis Can always increase sensitivity on the cost of specificity, or vice versa, the art is to - optimize both - then find the best trade-off. X X X X X X X X X
3000 3000 x3 ? 1500 200 1000 0 ? x1.5 A A B B C C But what if the gene is “off” (below detection limit) in one condition? ratios and fold changes Fold changes are useful to describe continuous changes in expression
ratios and fold changes The idea of the log-ratio (base 2) 0: no change +1: up by factor of 21 = 2 +2: up by factor of 22 = 4 -1: down by factor of 2-1 = 1/2 -2: down by factor of 2-2 = ¼ A unit for measuring changes in expression: assumes that a change from 1000 to 2000 units has a similar biological meaning to one from 5000 to 10000. What about a change from 0 to 500? - conceptually - noise, measurement precision
ratio compression Yue et al., (Incyte Genomics) NAR (2001) 29 e41
How to compare microarray intensities with each other? How to address measurement uncertainty (“variance”)? How to calibrate (“normalize”) for biases between samples?
Systematic Stochastic o similar effect on many measurements o corrections can be estimated from data o too random to be ex-plicitely accounted for o remain as “noise” Calibration Error model Sources of variation amount of RNA in the biopsy efficiencies of -RNA extraction -reverse transcription -labeling -fluorescent detection probe purity and length distribution spotting efficiency, spot size cross-/unspecific hybridization stray signal
bi per-sample normalization factor bk sequence-wise probe efficiency hik multiplicative noise ai per-sample offset eik additive noise The two component model measured intensity = offset + gain true abundance
“multiplicative” noise “additive” noise The two-component model raw scale log scale B. Durbin, D. Rocke, JCB 2001
Parameterization two practically equivalent forms (h<<1)
Important issues for model fitting Parameterization (model complexity) variance vs bias "Heteroskedasticity"(unequal variances) weighted regression or variance stabilizing transformation Outliers use a robust method Algorithm If likelihood is not quadratic, need non-linear optimization. Local minima / concavity of likelihood?
Models are never correct, but some are useful True relationship: Model: linear dependence Model: quadratic dependence
variance stabilizing transformations Xu a family of random variables with EXu=u, VarXu=v(u). Define var f(Xu ) independent of u derivation: linear approximation
1.) constant variance (‘additive’) 2.) constant CV (‘multiplicative’) 3.) offset 4.) additive and multiplicative variance stabilizing transformations
the “glog” transformation - - - f(x) = log(x) ———hs(x) = asinh(x/s) P. Munson, 2001 D. Rocke & B. Durbin, ISMB 2002 W. Huber et al., ISMB 2002
generalized log-ratio difference log-ratio variance: constant part proportional part glog raw scale log glog
parameter estimation (vsn package) o maximum likelihood estimator: straightforward – but sensitive to outliers o model is for genes that are unchanged; differentially transcribed genes act as outliers. o robust variant of ML estimator, à la Least Trimmed Sum of Squares regression. o works well as long many genes are not differentially transcribed (<50% throughout the intensity range)
“usual” log-ratio 'glog' (generalized log-ratio) c1, c2are experiment specific parameters (~level of background noise)
Variance Bias Trade-Off Estimated log-fold-change log glog Signal intensity
Variance-bias trade-off and shrinkage estimators Shrinkage estimators: a general technology in statistics: pay a small price in bias for a large decrease of variance, so overall the mean-squared-error (MSE) is reduced. Particularly useful if you have few replicates. Generalized log-ratio is a shrinkage estimator for fold change
“Single color normalization” • n red-green arrays (R1, G1, R2, G2,… Rn, Gn) • within/between slides • for each slide i=1…n • calculate Mi= log(Ri/Gi), Ai= ½ log(Ri*Gi) • normalize Mi vs Ai • Then normalize M1…Mn • all at once • normalize the combined matrix (R, G) • then calculate log-ratios or any other contrast you like
What about non-linear effects? o Good data operate in the linear regime, where fluorescence intensity increases proportionally to target abundance (see e.g. Affymetrix dilution series) Two reasons for non-linearity: oAt the high intensity end:saturation/quenching. This can and should be avoided experimentally - loss of data! oAt the low intensity end:background offsets
Response curveLockhart et. al. Nature Biotechnology 14 (1996)
Probe set summaries for Affymetrix expression analysis genechips
PMijg , MMijg= Intensities for perfect match and mismatch probe j for gene g in chip i i = 1,…, n one to hundreds of chips j = 1,…, J usually 11 or 16 probe pairs g= 1,…, G 6…30,000 probe sets. Tasks: calibrate (normalize) the measurements from different chips (samples) summarize for each probe set the probe level data, i.e., 16 PM and MM pairs, into a single expression measure. compare between chips (samples) for detecting differential expression. Probe set summarization - data and notation
Affymetrix GeneChip MAS 4.0 software used AvDiff, a trimmed mean: o sort dj = PMj -MMj o exclude highest and lowest value o J := those pairs within 3 standard deviations of the average Expression measures: MAS 4.0
Instead of MM, use "repaired" version CT CT= MM if MM<PM = PM / "typical log-ratio" if MM>=PM "Signal" = Tukey.Biweight (log(PM-CT)) (… median) Tukey Biweight: B(x) = (1 – (x/c)^2)^2 if |x|<c, 0 otherwise Expression measures MAS 5.0
dChip fits a model for each gene where qi: expression index for gene i fj: probe sensitivity Maximum likelihood estimate of MBEI is used as expression measure of the gene in chip i. Need at least 10 or 20 chips. Current version works with PMs only. Expression measures: Li & Wong
o Estimate one global background value b=mode(MM). No probe-specific background! o Assume: PM = strue + b Estimate s0 from PM and b as a conditional expectation E[strue|PM, b]. o Use log2(s). o Nonparametric nonlinear calibration ('quantile normalization') across a set of chips. Expression measures RMA: Irizarry et al. (2002)
RMA Additive model for probe effects Pj and expression value Ei log2Sij = Ei + Pj + εij Estimate Eiusing robust procedure
ArrayQualityMetrics R package by Audrey Kauffmann (EBI) Collaboration with Alvis Brazma, Misha Kapushesky (ArrayExpress) EU Project "Emerald" http://www.microarray-quality.org
A probe effect normalisation for tiling arrays Huber et al., Bioinformatics 2006
Genechip S. cerevisiae Tiling Array 4 bp tiling path over complete genome (12 M basepairs, 16 chromosomes) Sense and Antisense strands 6.5 Mio oligonucleotides 5 mm feature size manufactured by Affymetrix designed by Lars Steinmetz (EMBL & Stanford Genome Center)