Download
1 / 21
210 likes | 333 Views
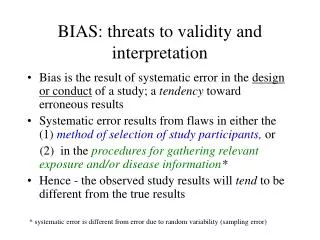
Assessing Laboratory Quality – Systematic Bias. Robert O. Miller Colorado State University Fort Collins, CO. Method Performance. Soil Analysis Bias and Precision . Bias (accuracy) and precision is best depicted by the target bulls eye. .

E N D
Assessing Laboratory Quality – Systematic Bias Robert O. Miller Colorado State University Fort Collins, CO
Method Performance Soil Analysis Bias and Precision Bias (accuracy) and precision is best depicted by the target bulls eye. http://www.paduiblog.com/uploads/image/Harrisburg%20DUI%20Lawyer%20accurate%20and%20precise.gif Bias evaluates soil test consistency between labs, important to the industry, whereas precision defines the uncertainty of the soil test within a laboratory. http://www.amrl.net/AmrlSitefinity/Newsletter/images/Spring2012/5_image%201.jpg Miller, 2013
Assessing Bias Soil Analysis Bias and Precision Assessment of lab method bias is can be achieved through certified reference samples and/or lab proficiency samples. Bias can be random, indicating no pattern across multiple reference samples, or systematic in one direction. Bias can be concentration dependent. Laboratory corrective actions is dependent on the type of bias encountered. Miller, 2013
Proficiency Reports With the completion of each ALP cycle a report is prepared for each lab participant. Soil test results with values exceeding a 95% confidence limit are flagged and precision flagged for samples exceeding 3 x Rd. Miller, 2013
Consensus Value: pH (1:1) H2O Lab #1 Systematic Bias 1Results ranked from low to high based on soil SRS-1111. Miller, 2013
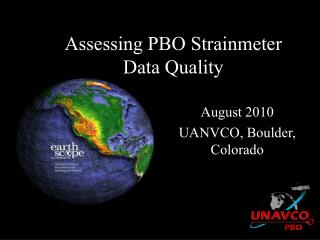
Soil Proficiency Observations - pH 2012 data was compiled for sixteen Illinois labs across 15 soils. Individual lab reports were provided to participants. Deviation and regression plots provide information systematic bias across 15 soils ranging from pH 5.29 to 7.86. Deviation plots indicate absolute differences for individual samples, whereas regression plots show an overall comparison for the year. Miller, 2013
Laboratory Performance Regression Analysis pH, 2011 1 Regression analysis provides insight on lab method bias. An evaluation of soils with pH 4.98 - 8.10 slope shows 1 of 8 labs deviate by > 5% from the median for the 2011 ALP soils. Regression intercepts deviated > 0.35 units for 2 of 8 labs shown. Source: ALP 2011 database. Eight of 48 labs shown. Miller, 2013
Laboratory Performance Deviation Plot Mehlich 1-P, 1 A year summary provides insight on lab method bias. Results for lab U7255A show random deviations at top left. Lab U6388A, lower left, consistent low bias across all PT cycles. 255 ppm 1 Source: ALP 2012 database. Soil M1-P values range 2 - 255 ppm.
Laboratory Performance Deviation Mehlich 3-P ICP Lab U6289A indicates deviations in 2012 cycle 17, none in cycle 18 and bias high deviations in cycle 19. Lab U7135A indicates significant high bias deviations on two of fifteen samples – these had M3-P concentrations > 150 ppm. 1 Source: ALP 2012 database. Soil M3-P ICP values range 1 - 166 ppm. Miller, 2013
Laboratory Performance Deviation Plot M3-K Lab U6289A indicates high bias deviations in 2012 cycle 17, none in cycle 18 and general two of five in cycle 19. Lab U7135A indicates general low bias deviations across all samples independent of concentration. 1 Source: ALP 2012 database. Soil M3-K values range 39 - 502 ppm. Miller, 2013
Evaluating Laboratory Bias *Bias Flag(s) Multiple Flags ( 2-5 ) Single Flag - Random Error - Near Detection Limit - Dilution Error - Transcription Error - Problematic Sample Consistent Low Bias Consistent High Bias Both Low and High Bias Low Bias at all Concentrations High Bias at all Concentrations Dominant High Bias Evaluation based on assessment of five proficiency soils. Low Bias at low Concentrations High Bias at Low Concentration Equal High and Low Bias Low Bias at high Concentrations High Bias at High Concentration Miller, 2013
Evaluating Laboratory Bias Multiple Flags ( 2-5 ) Consistent High Bias Both Low and High Bias Consistent Low Bias - Verify calibration Stds - Verify extractant volume - Check extractant Conc. Low Bias at all Concentrations Systematically evaluate each component of the analysis, extraction, analysis and reporting relative to low bias. - Verify low calibration Stds - Verify extractant volume - Check extractant Conc. Low Bias at low Concentrations Low Bias at high Concentrations - Verify calibration Stds - Verify extractant volume - Check Extractant Conc. Miller, 2013
Evaluating Laboratory Bias – Cont. Multiple Flags ( 2-5 ) Both Low and High Bias Consistent High Bias Consistent Low Bias - Check for Contamination - Verify calibration stds - Check extractant Conc. - Verify MDL Systematically evaluate each component of the analysis, extraction, analysis and reporting relative to high bias. High Bias at all Concentrations High Bias at Low Concentration - Check for Contamination - Verify low calibration Stds - Verify extractant volume - Check extractant Conc. High Bias at High Concentration - Verify calibration Stds - Verify extractant volume - Check Extractant Conc. Miller, 2013
Determining Method Bias Components Cause-and-effect diagrams are used to systematically list the different component sources which contribute to total of bias in the analysis results. A cause-and-effect diagram can aid in identifying those sources with the greatest contribution. “Ishikawa Diagram” Test Result Miller, 2013
Fish-Bone Diagram of Soil M3-P Analysis Use Component Factor Analysis to Assess Bias Extraction Extractant Shaker Extract Volume Time Filter Test Result Scoop Degree of Mixing Calibration Carry Over Technique Stability *Major Components Sample Homogeneity Operation Instrument Miller, 2013
Fish-Bone Diagram of Soil pH (1:1) H2O Bias Components Extraction - pH Calibration - Electrode - Other? Stirring Volume Test Result Scoop Degree of Mixing Calibration Carry Over Technique Stability Sample Homogeneity Electrode Instrument Miller, 2013
Example Bias Assessment Plot M3-Ca Lab U6816A Fifteen soils ranging from 609-5100 ppm Ca, show significant systematic bias, trending low on soils with low M3-Ca and high on high testing soils. Best shown with regression with slope of 1.20, intercept is -344. Low bias on low soils, high bias on high soils. Source of Bias? (1:1 line) Miller, 2013
Diagram of Mehlich 3 Ca – Lab U6816A Extraction Bias Components - Calibration Standards - Reagent pH, Concentration - Instrument Carryover - Other? Volume Reagent Shaker Contamination Temperature Filter Paper Filter Time Bias of Result Carry Over Scoop Stability Degree of Mixing Calibration Technique ICP For Ca, values in red may contribute to bias. Number Wavelength Homogeneity Analysis Miller, 2013
Example Bias Assessment Check off List Review bias results and develop a check off list as to extraction and analysis components which contribute to bias as it relates to concentration. From this list develop a systematic to assess source of bias analytical results. Miller, 2013
Quality Flossing Like dental hygiene, one should periodically assess your lab’s QC program effectiveness. Through a review of PT program results, use of external standards, and double blind evaluations it’s good lab practice to evaluate lab bias and precision and make modifications to the QC program. Miller, 2013