Download
1 / 18
180 likes | 305 Views
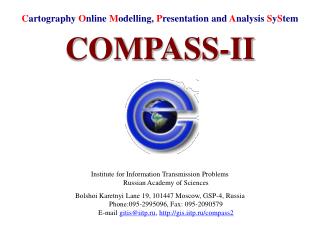
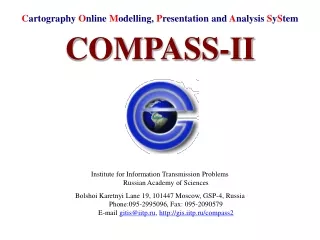
COMPASS C omprehensive O nline M apping for P olicy A nalysis and S upport S ervices. prepared by James E. Mitchell, Ph. D. Department of Transportation & Development IT GIS Manager (updated February 2011). History of Mapping in the US. 1879 - US Geological Survey established

E N D
COMPASSComprehensive OnlineMapping for Policy Analysis and Support Services prepared by James E. Mitchell, Ph. D. Department of Transportation & Development IT GIS Manager (updated February 2011)
History of Mapping in the US 1879 - US Geological Survey established 1882 - Topographic Mapping Program begins 1980s – Last 7½-minute Quadrangle Map completed for Louisiana 2000 – Funds for Federal Mapping terminated 2002 – USGS creates The National Map program to start digital mapping DOTD has been the lead for Louisiana in the USGS Cooperative Topographic Mapping Program since its inception. DOTD has spent $150,000 per year for map revisions with USGS. This updated 12-20 maps (depending on content) of the approximately 900 maps for Louisiana In 2007 USGS declared,“We have 5 quads to finish up for Louisiana, and have no plans to do anymore, anywhere.”
From Paper Maps the Digital Data Over the past century mapping has evolved from scribing single maps, one at a time, to aerial photogrametry, automated mapping, and GIS. Modern methods can cost-effectively update features across large areas and revise whole series of maps According to the USGS:“…the average primary series topographic map is 23 years old. Frequent changes on the landscape mean that many of these maps are no longer accurate and complete.”
The Current Status of Paper Maps Updated January 2012
How Up to Date are Louisiana’s Maps? • All paper maps are 6 years or older • 97% of paper maps are 10 years or older • 77% of paper maps are 15 years or older • 60% of paper maps are 20 years or older • 37% of paper maps are 25 years or older • 21% of paper maps are 30 years or older Digital map data have never been updated and are older than the paper maps (Updated January 2012)
The Paradigm Shift Before, the Maps Made the Data - Now, the Data Make the Maps Originally maps were hand-scribed and printed on paper. Today’s GIS data were digitized from those maps. The USGS mapping programs never made the paradigm change and were not able to keep up with the demands of modern mapping.
The National Map In 2005, the USGS created The National Map to modernize their mapping program. With no funds, the burden of financing new maps is placed on state and local government USGS says:“USGS will encourage the participation of organizations and private citizens to serve as a volunteer force for change detection, data compilation, and validation.”
The Seamless Map Supports All Digital and Analog Activities Framework Data Layers • Hydrology (rivers, lakes, ponds, watershed boundaries, NHD model) • Hypsography (elevation, breaklines, DEM) • Transportation (roads, bridges, railroads, transmission lines, pipelines) • Boundaries (Federal, state, parish, & local government;) • Man-Made Structures (government buildings, hospitals, schools, churches, emergency facilities) • Vegetation/non-vegetation coverage's (Including land use) • Public Land Survey System Grid Mitigation Related Data Layers • Shelters (with capacities & Utilities availability) • Areas for Temporary Facilities (tent cities, manufactured housing, trailer parks; with available utilities) • Medical Treatment Sites
Essential Functions In All Agencies Are Supported From One Map Emergency Preparedness – DOTD, State Police, and OEP used GIS to create the Louisiana Emergency Evacuation Plan Emergency Response – DOTD, DWF, OEP, State Police, 911, and federal agencies collaborated with GIS Statewide Hurricane Recovery – DOTD and DEQ collaborated in finding debris collection points, tabulating removal, and safely routing trucks Coastal Restoration – DOTD, DNR, DEQ, and others collaborate on coastal restoration projects Hazard Mitigation – GOHSEP must compile a State Hazard Mitigation Plan; GIS is essential in evaluating risk, as well as, sharing data and presenting it to the public National Flood Insurance – DOTD is the lead agency for NFIP; GIS data can provide more accurate maps, faster and keep them up to date Customer Service – Agencies maintain databases of customers, vendors, service locations, and other address information that can be shared and disseminated to the public via the Internet
What are the Problems with Our Current Digital Maps from USGS? • USGS produced maps cartographically, not using modern digital techniques • No maps “edge-match” and features break along map boundaries • It is too expensive to update more than a few maps at a time • Adjacent maps can be produced decades apart • Different themes on the same map may have come from data collected decades apart • Some maps show land surface elevation contours within water features, creating inaccuracies and confusion • Current development and road systems are not shown • Land cover and land use are not current
USGS Maps Do Not Edge-match As lines cross map boundaries they do not meet their counterpart on the next map.
Our Data and Our Coastline The yellow lines are where best-available digital data show the land-water boundary. The image is post-hurricane orthophotography. Neither match the maps.
Where Do We Build Infrastructure? The first step in a project is to estimate the scope of the work. Much of this is done with maps and GIS. The best-available data are labeled as “USGS NHD” and clearly do not match the shoreline on the image. The remaining lines show how GIS-based photo-revision techniques can be used to update the data.
Why are Land Contours in the Water? USGS maps are comprised of seven “framework themes” (water, elevation, transportation, boundaries, benchmarks, vegetation, and structures). USGS does not update all themes simultaneously. In recent years, USGS has not updated the land surface elevation theme. This map shows how the old elevation contours (brown) lie in the updated water (blue). The thick red lines show the photo-revised locations of the shoreline and other water features from the 2004 orthophotos.
The Solution – Implement Comprehensive Online Mapping for Policy Analysis and Support ServicesCOMPASS Step 1 – Clarify the role of DOTD in mapping Louisiana Historical/Legislative History Act 159 of 1928 Act 508 of 1929 USGS Cooperative Topographic Mapping Program The USGS National Map Program
COMPASSStep 2 - Use Existing Data Use Existing data and national mapping programs to update the digital map base. The data are already available:Louisiana has already made a large investment in data using high resolution photography, LIDAR, and GPS. These are programs that are already in place. Existing programs include: Tele Atlas – The largest private-sector vendor of street, address, and navigation data (already a DOTD vendor) NED – The National Elevation Database (USGS)Digital Elevation Models (DEM) and contour lines NHD – The National Hydrology Database (USEPA & USGS)Hydrologic Network with database and attributes for modeling WBS – The Watershed Boundaries Database (USDA-NRCS)Basin boundaries for water and land use modeling and management NFIP – The National Flood Insurance Program (DHS-FEMA)The basis for flood risk assessment and flood insurance rates SURGO – Detailed soils data from Soil surveys (USDA-NRCS) All of these programs have standards in place and contractors who are qualified to produce the digital and paper products. They require state participation at 25% to 100%. Of the federal programs, none have complete coverage of Louisiana. All of the federal programs are currently using old, outdated USGS maps to develop their databases.
COMPASSStep 3 – Create the Digital Infrastructure to Maintain and Distribute the Data The data from this program will be available to all levels of government, local, state, and federal.The data will be stored, centrally and distributed via the Internet, disk media, and hardcopy, to serve the needs of the individual user. This will require: • A moderate increase in storage space (less than a Terabyte), not currently available at DOTD • A server to provide the data management and distribution capacity, not currently available at DOTD • Hardware for paper map production, not currently available at DOTD All of these represent new capacity that does not exist, anywhere in the state
What Will It Cost? Photo-revision of all Quadrangle Maps - $8.5 to 10 Million This depends on data (e.g., availability and format of address data for local roads, LRS development, etc.). Infrastructure for management and distribution - Less than $30,000This will provide additional storage, software for data management and map production, and data distribution via the Internet Priceless! The Benefits -