Download
1 / 7
70 likes | 157 Views
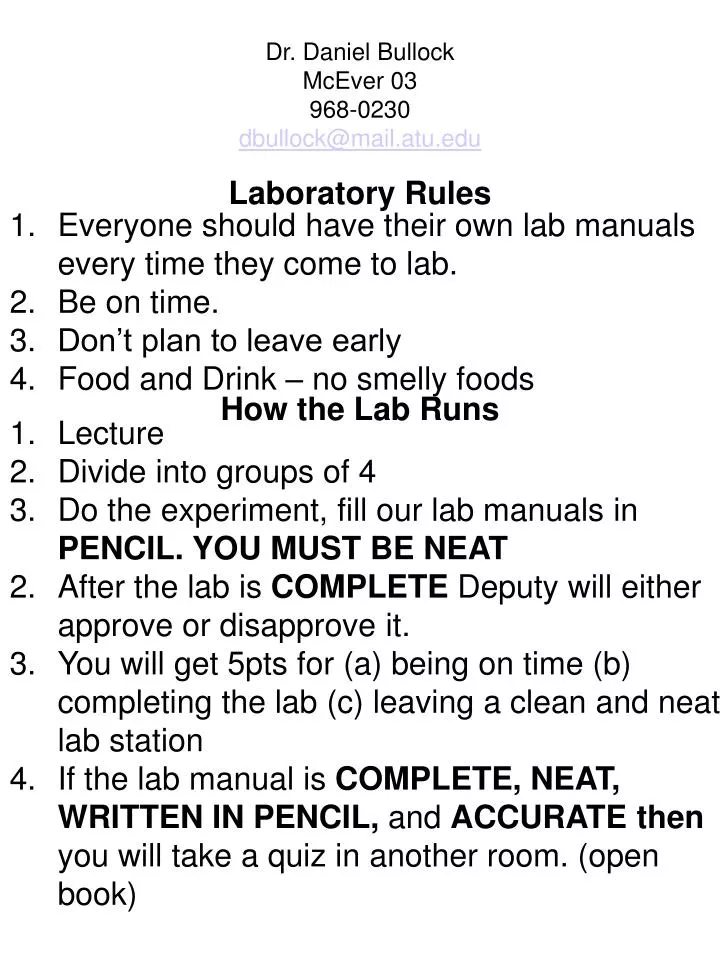
Dr. Daniel Bullock McEver 03 968-0230 dbullock@mail.atu.edu. Laboratory Rules. Everyone should have their own lab manuals every time they come to lab. Be on time. Don’t plan to leave early Food and Drink – no smelly foods. How the Lab Runs. Lecture Divide into groups of 4

E N D
Dr. Daniel Bullock McEver 03 968-0230 dbullock@mail.atu.edu Laboratory Rules • Everyone should have their own lab manuals • every time they come to lab. • Be on time. • Don’t plan to leave early • Food and Drink – no smelly foods How the Lab Runs • Lecture • Divide into groups of 4 • Do the experiment, fill our lab manuals in • PENCIL. YOU MUST BE NEAT • After the lab is COMPLETE Deputy will either approve or disapprove it. • You will get 5pts for (a) being on time (b) completing the lab (c) leaving a clean and neat lab station • If the lab manual is COMPLETE, NEAT, WRITTEN IN PENCIL, and ACCURATE then you will take a quiz in another room. (open book)
GRAPHING • You must be neat when you graph. • You must use a straight edge to draw lines, and French Curves to draw curves. • Your graph must have: TITLE, AXIS TITLES, DATA IDENTIFIERS, APPROPRIATE SCALES • We will talk about this more in a minute. • LAB IS SUPPOSED TO HELP YOUR LECTURE GRADE!!!! IF YOU DO THE WORK YOU WILL DO FINE IN THE LAB!
MEASUREMENTS AND ERRORS Two common types of errors: 1. Random error: due to the precision of the measuring device and the individual doing the measurement. These can be minimized by doing the measurement several times. 2. Systematic error: due to things that are wrong with the system. Caused by faulty or uncalibrated equipment. These are easy to fix if you know about them. SEE GUN EXAMPLE
0 1 2 cm Significant Figures The rule for estimating sig. Figs. Is one-half the smallest division on the instrument. How long is the pencil? It’s somewhere between 1.5cm and 1.6cm If we follow our rule we could record 1.50, 1.55 or 1.60 How do you count the # of sig figs? 1st locate the first nonzero figure on the right and count right. 0.0320 would have 3 sig figs. Math operations with sig figs: # of sig figs is equal to the # of the lowest sig fig.
3 sig figs. 52.3 +0.432 52.7 4 sig figs. 23.21 X 3.1 71.92 2 sig figs. How about this example? So we should record our answer with 2 sig. Figs resulting in an answer of: 72
When Graphing Consider the following data: Velocity Time 7 2 11 4 15 6 19 8 THIS IS A BAD GRAPH