Download
1 / 7
70 likes | 258 Views
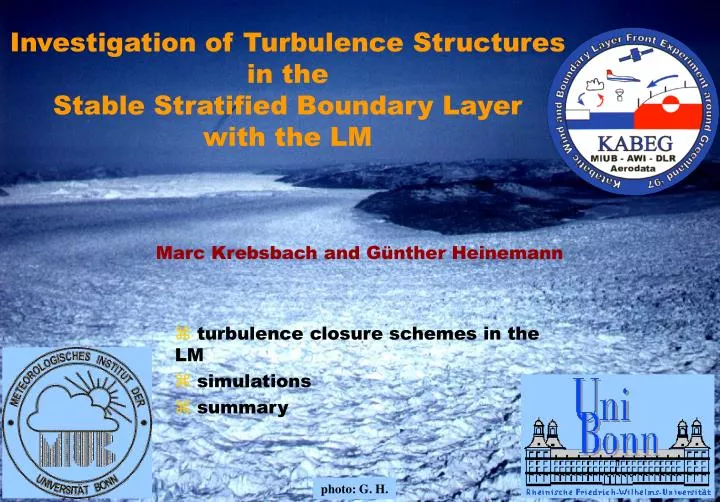
Investigation of Turbulence Structures in the Stable Stratified Boundary Layer with the LM. Marc Krebsbach and Günther Heinemann. turbulence closure schemes in the LM simulations summary. photo: G. H. turbulence closure schemes in the LM diagnostic scheme prognostic scheme.

E N D
Investigation of Turbulence Structures in theStable Stratified Boundary Layerwith the LM Marc Krebsbach and Günther Heinemann • turbulence closure schemes in the LM • simulations • summary photo: G. H.
turbulence closure schemes in the LMdiagnostic scheme prognostic scheme • closure order 1.5 with prog. TKE • ‘level 2’ (Mellor & Yamada, 1982) • more terms • vertical diffusion of TKE • expanded solution under stable conditions • additional item: circulation term with • modified procedure after Müller (1981) solutions in terms of Mellor, G. L. and T. Yamada: 1982, ‘Development of a Turbulence Closure Model for Geophy-sical Fluid Problems‘. Rev. Geophys. Space Phys. 20(4), 851–875 Müller, E.: 1981, ‘Turbulent flux parameterisation in a regional scale model‘. ECMWF workshop proceedings, 25.–27. November, 193–220
simulations model area around Kangerlussuaq Greenland map Pa Pb 100 km
simulationsdiagnostic scheme prognostic scheme grid point height AGL in m
simulationsdiagnostic scheme grid point height AGL in m height AGL in m
simulationsprognostic scheme grid point height AGL in m height AGL in m
summary • LM is able to simulate complex flow structures in tundra region • different reaction to variations of closure length • mean quantities: accurate for diagnostic scheme, some disadvantages in the lowest 100 m AGL • turbulent quantities: clear advantage of the prognostic scheme • no pattern length scale in the investigated SBL • closure length has to be adapted to the SBL • turbulent fluxes: • max. ; mean o.k. • successful simulation of a hydraulic jump