Download
1 / 1
10 likes | 118 Views
Control Point Id. USGS Total Upstream Area (sq.mi.). USGS Contributing Area. Incremental Non-Contributing Area. % Diff in Incremental Drainage Area. 08079550. 5588. 236. 5352. -95.8. 08079600. 1466. 244. 1222. -83.4. 08080500. 8796. 1864. 358. -20.6. 08080700. 1291. 382. 909.

E N D
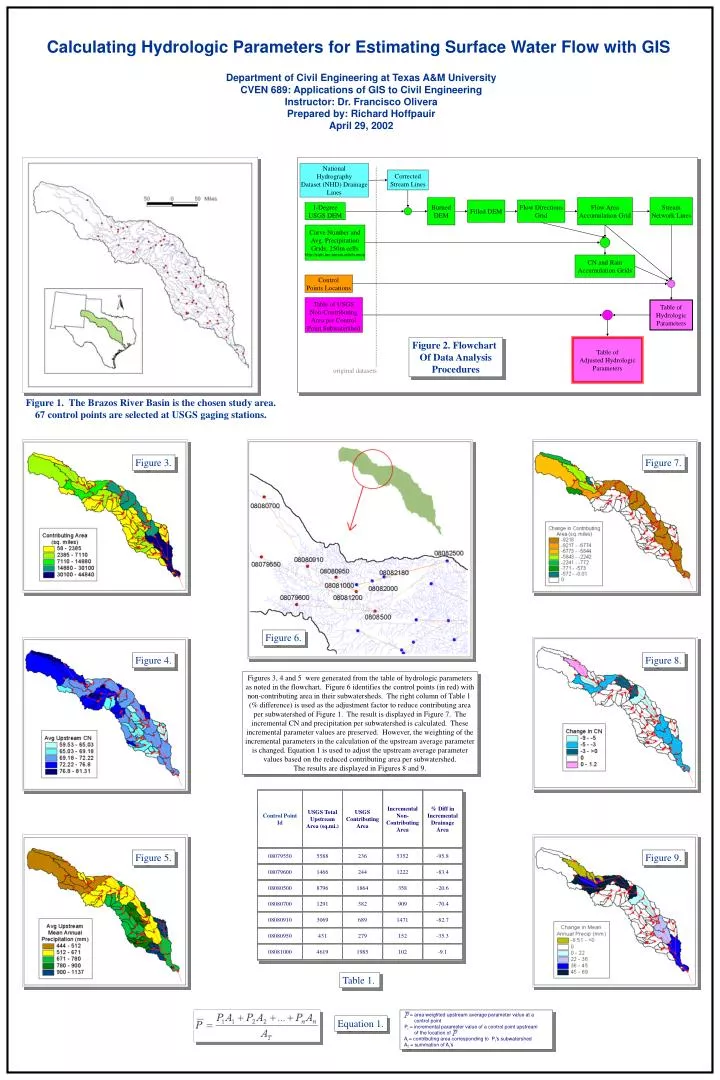
Control Point Id USGS Total Upstream Area (sq.mi.) USGS Contributing Area Incremental Non-Contributing Area % Diff in Incremental Drainage Area 08079550 5588 236 5352 -95.8 08079600 1466 244 1222 -83.4 08080500 8796 1864 358 -20.6 08080700 1291 382 909 -70.4 08080910 3069 689 1471 -82.7 08080950 431 279 152 -35.3 08081000 4619 1985 102 -9.1 Calculating Hydrologic Parameters for Estimating Surface Water Flow with GIS Department of Civil Engineering at Texas A&M University CVEN 689: Applications of GIS to Civil Engineering Instructor: Dr. Francisco Olivera Prepared by: Richard Hoffpauir April 29, 2002 National Hydrography Dataset (NHD) Drainage Lines Corrected Stream Lines Burned DEM Flow Area Accumulation Grid Stream Network Lines Filled DEM Flow Directions Grid 1-Degree USGS DEM Curve Number and Avg. Precipitation Grids, 250m cells http://srph.brc.tamus.edu/humus CN and Rain Accumulation Grids Control Points Locations Table of USGS Non-Contributing Area per Control Point Subwatershed Table of Hydrologic Parameters Figure 2. Flowchart Of Data Analysis Procedures Table of Adjusted Hydrologic Parameters original datasets Figure 1. The Brazos River Basin is the chosen study area. 67 control points are selected at USGS gaging stations. Figure 3. Figure 7. Figure 6. Figure 4. Figure 8. Figures 3, 4 and 5 were generated from the table of hydrologic parameters as noted in the flowchart. Figure 6 identifies the control points (in red) with non-contributing area in their subwatersheds. The right column of Table 1 (% difference) is used as the adjustment factor to reduce contributing area per subwatershed of Figure 1. The result is displayed in Figure 7. The incremental CN and precipitation per subwatershed is calculated. These incremental parameter values are preserved. However, the weighting of the incremental parameters in the calculation of the upstream average parameter is changed. Equation 1 is used to adjust the upstream average parameter values based on the reduced contributing area per subwatershed. The results are displayed in Figures 8 and 9. Figure 5. Figure 9. Table 1. area weighted upstream average parameter value at a control point Pi incremental parameter value of a control point upstream of the location of Ai contributing area corresponding to Pi's subwatershed AT summation of Ai’s Equation 1.