Download
1 / 24
240 likes | 363 Views
Peanut Response to Simulated Drift Rates of 2,4-D. R.M. Merchant*, E.P. Prostko, P.M. Eure , and T.M. Webster . - 2012. Introduction - I. In Georgia, peanuts were planted on nearly 202,000 ha in 2012. Introduction - II.

E N D
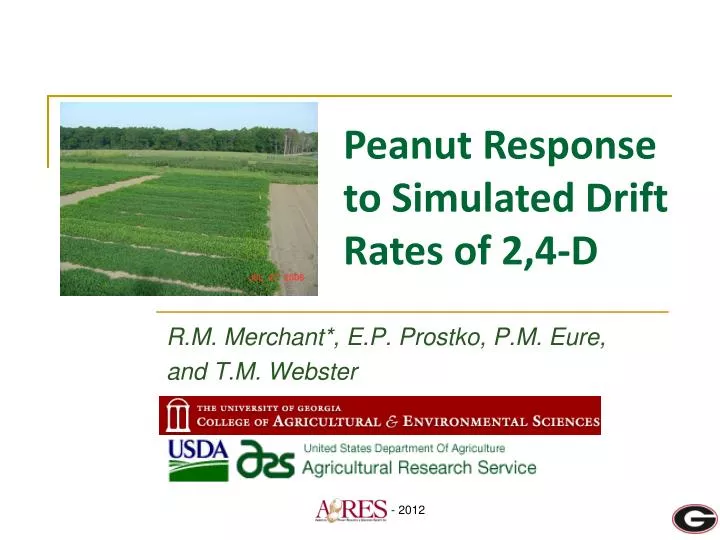
Peanut Response to Simulated Drift Rates of 2,4-D R.M. Merchant*, E.P. Prostko, P.M. Eure, and T.M. Webster - 2012
Introduction - I • In Georgia, peanuts were planted on nearly 202,000 ha in 2012
Introduction - II • Cotton and Soybeans are grown in close proximity to peanuts in Georgia
Introduction - III • Damage to peanut from commonly used cotton and soybean herbicides does occur • Glyphosate and glufosinate occur most often • Previous research has quantified the effects of these herbicides (Prostko et al. ) glyphosate glufosinate
Introduction - IV • New technologies allow for POST topical application of 2,4-D or dicamba in cotton and soybean • Confusion of 2,4-D with 2,4-DB has consequences
Objective To determine peanut yield response to simulated drift and tank contamination rates of 2,4-D amine
Materials and Methods - I • 2 Field Trials • UGA Ponder Research Farm (Worth Co.) • Attapulgus Research/Extension Center (Decatur Co.) • ‘GA-06G’ • Split-plot, 4 replications • Whole Plot • 30, 60, 90 DAP • Sub-plot • 2,4-D amine rate • Weedar 64 Amine (3.8 lbs/gal) • 105, 210, 420, 840, 1680 g ai/ha
Materials and Methods - II • CO2-pressurized backpack sprayer • 140 L/ha • Visual estimates of crop injury • 0 -100% • Yield • 100 pod/seed weights
R1 R2 R3 Beginning bloom Beginning peg Beginning pod R4 R5 R6 Full pod Beginning seed Full seed R7 Reproductive Growth Stages of Peanut Growth stages of peanut K. J. Boote, Peanut Science 9:35-40 Beginning maturity
Statistical Analysis • Data combined over locations and subjected to ANOVA • Significant interaction between treatment and yield at 30 and 60 DAP • Regression analysis using Sigma Plot 11
Yield Response – 30 DAP y= 699760 1+e-(x-169/13.8) r2= 0.57 p= <0.0001 105 420 1680 Rate ( g ai/ha)
1680 g ai/ha 105 g ai/ha 1 week after treatment
Yield Response – 60 DAP y= 9.86 + 0.82x r2= 0.26 p= 0.003 105 420 1680 Rate ( g ai/ha)
1680 g ai/ha 105 g ai/ha 1 week after treatment
Yield Response – 90 DAP 105 420 1680 Rate ( g ai/ha)
1680 g ai/ha 105 g ai/ha 1 week after treatment
Summary 105 420 1680 Rate ( g ai/ha)
Summary • Yield loss increased as rate increased when 2,4-D was applied 30 DAP and 60 DAP • There was no significant loss of yield when 2,4-D was applied 90 DAP at any rate
Conclusions • 2,4-D was most injurious when applied at 60 DAP • There was no negative effect at 90 DAP • Growers must be cautious when applying 2,4-D
Future Research • Currently repeating tests at 2 locations in 2012 • Earlier times of application • 10, 20 DAP • Continue to screen current and future herbicides for off-target/contamination damage to peanut