Download
1 / 26
260 likes | 375 Views
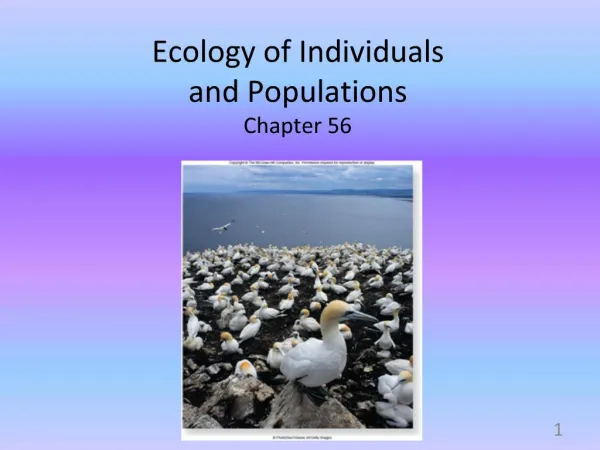
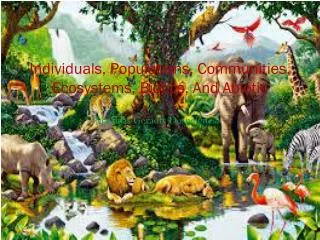
From individuals to populations. The basic entities of ecological research. Bees, ants, and other insect societies form superorganisms that behave as an ecological unit. Single information coding strand of DNA. Single celled Bacteria. Clonal organisms might have extreme longivity.

E N D
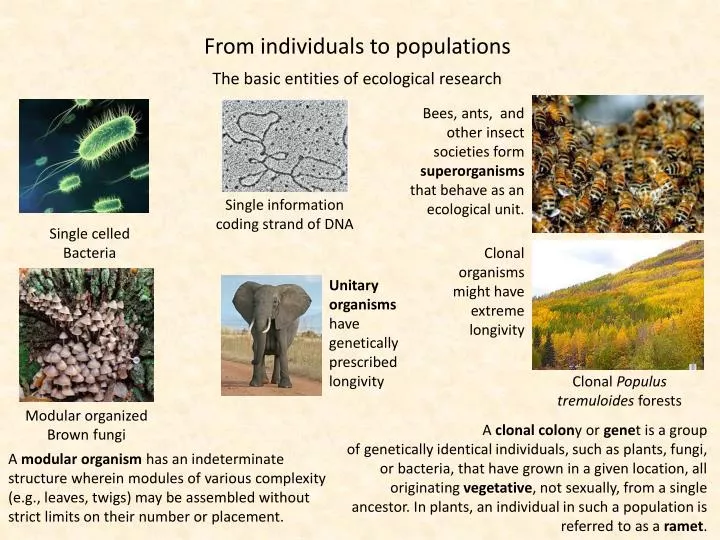
From individuals to populations The basic entities of ecological research Bees, ants, and other insect societies form superorganismsthat behave as an ecological unit. Single information coding strand of DNA Single celled Bacteria Clonal organisms might have extreme longivity Unitary organisms have genetically prescribed longivity Clonal Populustremuloides forests Modular organized Brown fungi A clonal colony or genet is a group of genetically identical individuals, such as plants, fungi, or bacteria, that have grown in a given location, all originating vegetative, not sexually, from a single ancestor. In plants, an individual in such a population is referred to as a ramet. A modular organism has an indeterminate structure wherein modules of various complexity (e.g., leaves, twigs) may be assembled without strict limits on their number or placement.
Life cycles All organisms have life cycles from single celled zygotes through ontogenetic stages to adult forms. All organsims finally die. k2 k4 k1 k3 k5=1 Often stages of dormancy Mortality Type I, high survivorship of young individuals: Large mammals, birds Type II, survivorship independent of age, seed banks Type III, low survivorship of young individuals, fish, many insects Age dependent survival in annual plants Type I Type II Surviving individuals Surviving individuals Type III Individual age Individual age
K-factor analysis k2 k4 k1 k3 k5 Each life stage t has a certain mortality rate dt. The k-factor is the difference of the logarithms of the number of surviving indiiduals at the beginning and the end of each stage. A simple life table k-factors calculated for a number of years
Densityseries Time series 2000 2001 Density Cleartemporaltrends in mortalityrates No densitydependencein mortalityrates
Allometric constraints on life history parameters Mammals Body size is an important determinant on life history. Insects Microorganisms Birds Various vertebrates
Life history trade-offs Optimal food intaketime Optimaloffspringnumber Fitness Quality of food Survivalprobability Degree of starvation Number of offspring Time Trade-offs: Organisms allocate limited energy or resources to one structure or function at the expense of another. Allspecies face trade-off. Trade-offs shape and constrain life history evolution. Complex life histories appear to be one way to maximize reproductive success in such highly competitive environments.
The importance of individualistic behaviour Th perceived food value migh remain more stable than food quality The value of food is the product of food quality and the difference of total amount N and amount consumed C). Amount of food consumed Food quality Food value Food quality X For different individuals it pays to use resources of different quality. Trade-offs between resource quality and resource availability at a given point of time mark the beginn of individualistic behaviour. Individualistic behaviour is already observable in bacteria. The precise estimation of resource value is one of the motors of brain evolution.
Trade-off decisions during life history At each time step in life animals take decisions. These decisions determine future reproductive success and ae objects of selective forces How large to grow? When to begin reproducing? How fast to grow? Each step is a decision on resource allocation. How often to breed? (semelparous, iteroparous) How long to live? How many offspring? When to change morphology? Caring for offspring? How long to live after reproduction? What size of offspring? How fast to develop? Different selective forces might act on different stages of life. Contrary forces might cause the development of subpopulations.
Contrasting selective forces on life history r-selection and K-selection describe two ends of a continuum of reproductive patterns. r refers to the high reproductive rate. K refers to the carrying capacity of the habitat Rana temporaria Brookesia desperata High reproduction rate High population growth Low parental investment No care of offspring Often unstable habitats Low reproduction rate Low population growth High parental investment Intensive care of offspring Often stable habitats r Continuum K In many species different developmental stages,the sexes and particulalry subpopulations range differently on the r/K continuum! K selected mature more slowly and have a later age of first reproduction have a longer lifespan have few offspring at a time and are iteroparous have a low mortality rate and a high offspring survival rate have high parental investment Have often relatively stable populations r selected species mature rapidly and have an early age of first reproduction have a relatively short lifespan have few reproductive events, or are semelparous have a high mortality rate and a low offspring survival rate have minimal parental care/investment are often highly variable in population size Literature: Reznick et al. 2002, Ecology 83.
The growth of populations +N(t) Equilibrium Birth rate: Death rate: Birth excess Number of births Population size Number of deaths Time The net reproductive rate R is the number of reproducing female offspring produced per female per generation. Population fluctuations Equilibrium density If R > 1: population size increases If R = 1: population remains stable If R < 1: population size decreases Population size The density of a population is the average number of individuals per unit of area. Abundance is the total number of individuals in a given habitat. Amplitude Time
The exponential growth of populations Population size The intrinsic rate of population growth r (per-capita growth rate) is fraction of population change per unit of time. Time If r > 0: population size increases If r = 0: population remains stable If r < 0: population size decreases North atlantic gannets in north-western England (Nelson 1978) Population doubling time Under exponential growth there is no equilibrium density. Exponential growth is not a realistic model since populations cannot infinite sizes. The growth rate is r = 0.057
The logistic growth of populations Populations do not increase to infinity. There is an upper boundary, the carrying capacity K. The logistic model of population growth The logistic growth function is the standard model in population ecology Pierre Francois Verhulst (1804-1849) Raymond Pearl (1879-1940)
The logistic growth of populations Maximum population growth The equilibrium population size Time t0 of maximum growth
The logistic growth of populations How to estimate the population parameters? Growth of yeast cells (data from Carlson 1913) K = 665 K/2 t0 t0=7.70 Logistic growth occurs particularly in organisms with non-overlapping (discrete) populations, particularly in semelparous species: e.g. bacteria, protists, single celled fungi, insects.
Logistic population growth implies a density dependent regulation of population size If N > K, dN/dt < 0: the population decreases Natural variability in population size Density dependence means that the increase or decrease in population size is regulated by population size. The mechanism of regulation is intraspecific competition. The number of offspring decrease with increasing population size due to resource shortage.
The Allee effect Logistic growth is equivalent to a quadratic function of population growth No Allee effect Weak Allee effect Strong Allee effect Population growth K K K/2 K N N N At low population size propolation growth is in many cases lower than predicted by the logistic growth equation. Allee extension of the logistic function Most often Allee effects are caused by mate limitation at low population densities A is an empitical factor that determines the strength of the Allee effect
Variability in population size Proportional rescaling Poisson random Density regulated J=1.14 J=0.91 J=0.82 We use the variance mean ratio as a measure of the type of density fluctuation Aphids Butterflies Birds Proportional rescaling The Lloyd index of aggregation needs m > > 1. Taylor’s power law
Fragmented landscapes Landscape ecology Agroecology
The metapopulation of Melitaeacinxia In fragmented landscapes populations are dived into small local populations separated by an inhostile matrix. Between the habitat patches migration occurs. Such a fragmented population structure connected by dispersal is called a metapopulation. Illka Hanski Glanville fritillary Melitaea cinxia
The Lotka – Volterra model of population growth Dispersal in a fragmentedlandscape Levins (1969) assumed that the change in the occupancy of single spatially separated habitats (islands) follows the same model. Assume Pbeing the number of islands (total K) occupied. Q= K-Pis then the proportion of not occupied islands. m is the immigration and e the local extinction probability. Emigration/Extinction Colonisations The Levinsmodel of meta-populations
Fragments differ in population size Colonisation probability is exponentially dependent on the distance of the islands and extinction probability scales proportionally to island size. The higher the population size is, the lower is the local extinction probability and the higher is the emigration rate 150 100 Distance If we deal with the fraction of fragments colonized 90 80 The canonical model of metapopulation ecology 200 Metapopulation modelling allows for an estimation of species survival in fragmented landscapes and provides estimates on species occurrences. Distance
Extinction times If we know local extinction times TL we can estimate the regional time TR to extinction When is a metapopulation stable? 1200 1000 800 Median time to extinction 600 400 The meta-population is only stable if m > e. 200 0 0 1 2 3 4 5 6 7 0.5 p K The condition for long-term survival
What does metapopulation ecology predict? Occurrences of Hesperia comma in fragmented landscapes in southern England (from Hanski 1994) Occurrences Absences Predictedextinctionthreshold In fragmentedlandscapesoccupancydeclinesnonlinear with decreasingpatcharea and with decreasingconncetivity (increasingisolation)
Extinction times of ground beetles on 15 Mazurian lake islands Local extinction times (generations) are roughly proportional to local abundances Population should be save if they occupy at least 12 islands.
SPOMSIM Populationecologyneedslong-term data sets