Download
1 / 10
100 likes | 232 Views
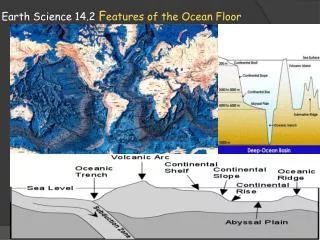
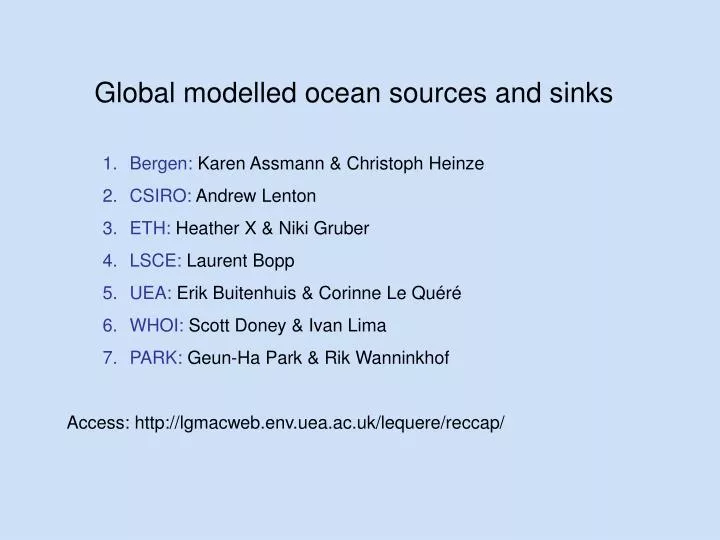
Global modelled ocean sources and sinks Bergen: Karen Assmann & Christoph Heinze CSIRO: Andrew Lenton ETH: Heather X & Niki Gruber LSCE: Laurent Bopp UEA: Erik Buitenhuis & Corinne Le Quéré WHOI: Scott Doney & Ivan Lima PARK: Geun-Ha Park & Rik Wanninkhof

E N D
Global modelled ocean sources and sinks • Bergen: Karen Assmann & Christoph Heinze • CSIRO: Andrew Lenton • ETH: Heather X & Niki Gruber • LSCE: Laurent Bopp • UEA: Erik Buitenhuis & Corinne Le Quéré • WHOI: Scott Doney & Ivan Lima • PARK: Geun-Ha Park & Rik Wanninkhof • Access: http://lgmacweb.env.uea.ac.uk/lequere/reccap/
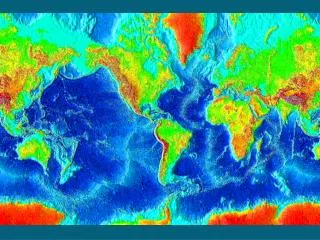
Model fields available netcdf format, World Ocean Atlas Grid, CMIP5 name/unit conventions
Global Ocean sea-air CO2 flux (PgC/y) Time (y)
Equatorial Pacific sea-air CO2 flux (PgC/y) data: mostly from R. Feely as summarised in Bousquet et al. (2000) Time (y)
Southern Ocean sea-air CO2 flux (PgC/y) Time (y)
total CO2 sink response to anthropogenic CO2 response to climate
response to climate > 30°N 30 °S – 30 °N < 30 °S
ocean inversions process models atm inversions observations