Download
1 / 11
110 likes | 204 Views
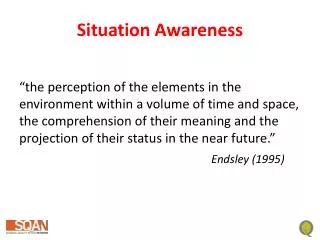
Using Smartphones to Enable Situation Awareness on Highways. Christian Manasseh May 3 , 2010. Experiment. Mobile phones were provided to 23 drivers: drivers were asked to drive for 6-10 weeks (2 weeks as baseline, last two weeks learning engine was turned on).

E N D
Using Smartphones to Enable Situation Awareness on Highways Christian Manasseh May 3, 2010
Experiment • Mobile phones were provided to 23 drivers: • drivers were asked to drive for 6-10 weeks (2 weeks as baseline, last two weeks learning engine was turned on) Part I - Is there an effect on driver behavior due to the alert? Part II - Is this a lasting effect, or does it fade away with time?
Data Analysis – Part I Two locations analyzed Data from 14 users 50 1sec-GPS traces
Speed profiles with and without alerts vs. distance (Location 1) Alert Issued No Alert Issued (During base-weeks and non-base weeks)
Speed profiles with and without alerts vs. distance (Location 1) Alert Issued No Alert Issued (During base-weeks and non-base weeks)
Space-mean-speed plot for the two cases Alert Issued No Alert Issued (During base-weeks and non-base weeks)
Data Analysis of the smoothness of traces at Location 1 A measurable difference in driver behavior due to the alert • STDEV of speeds for traces with no alerts: 16.45 +/- 3.07 mph (90% confidence) • STDEV of speeds for traces with alerts: 10.13 +/- 2.66 mph (90% confidence) • 38% smoother traces as a result of alerts • Worst case: 4.5% smoother traces
Speed Profiles with and without Alerts (Location 1) Trace “without a dip” Trace “with a dip” Alert Issued No Alert Issued (During base-weeks and non-base weeks)
Change in behavior due to alerts with time Percent of traces that have “dips” per week Weeks of Testing
Conclusion • There is a measurable change in driver behavior due to a soft safety alert • STDEV of speeds for traces with no alerts: 16.45 +/- 3.07 mph (90% confidence) • STDEV of speeds for traces with alerts: 10.13 +/- 2.66 mph (90% confidence) • This change experiences a novelty effect in the first 3 weeks of using the system; the change persists after the first 3 weeks of testing