Download
1 / 35
360 likes | 571 Views
Local and Global Winds. AIM : How is wind created?. Do Now:. Recall what creates areas of higher and lower air pressure. **FACT** Higher pressure air ( H ) is cooler, more clear, and drier than Lower pressure air ( L ) which is warmer, cloudier, and more moist. Air pressure Local winds

E N D
Local and Global Winds • AIM: How is wind created?
Do Now: • Recall what creates areas of higher and lower air pressure. • **FACT** • Higher pressure air (H) is cooler, more clear, and drier than Lower pressure air (L) which is warmer, cloudier, and more moist.
Air pressure Local winds Global winds Prevailing westerlies Isobars Cyclones Anti-cyclones Wind Chill factor Anemometer Wind Vane Vocabulary
1. What is wind? • Wind – the horizontal movement of air • ***Wind is created when the uneven heating of Earth’s surfaces creates areas of high and low pressure***. • Air likes to move from Higher pressure (H) to Lower pressure (L)
2. How is wind named and measured? • Named by the direction and speed from which it comes. Ex. Westerly wind comes from the West • Anemometer – measures wind speed using cups connected to a speedometer • Wind vane – points to direction that wind comes from
3. What are local winds? a. Local winds blow over short distances. b. Part of the weather report. weather.com c. Examples: Land breezes, sea breezes • Observe an animation of land and sea breezes.
4. Sea and Land Breezes • During night, cooler air sinks over the sand, warmer air rises over sea. • Air moves from land to sea = land breeze • During day, warmer air rises over the sand, cooler air sinks over sea. • Air moves from water to land = sea breeze L H H L
Sea and Land breezes are local winds that affect us near TOBAY or Jones Beach
5. Larger local breezes • Monsoon – sea or land breezes covering a large area that change directions with the seasons (Southeast Asia)
Winter: A large land breeze, sinking higher pressure air over land keeps moist air off shore =Good weather Summer: A large sea breeze, rising, moist air from over the ocean blows onto land = Bad weather, rain Monsoons
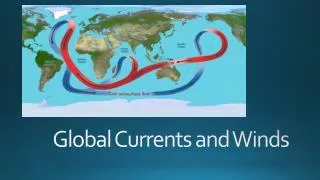
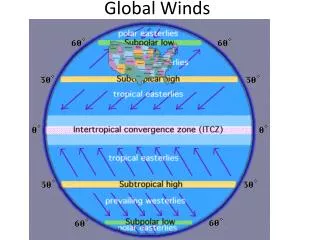
6. Global Winds • Global winds blow over a long distance from a specific direction • Created by uneven heating of equator and poles • H = poles, cool, sinking • L = equator, warm, rising • Weather patterns are affected by the prevailing winds in an area.
Name the prevailing winds that affect each area…ESRT pg 14 • Latitude – distance from Equator • Horse latitudes – areas where air sinks, at 30°N and 30°S • Doldrums – areas with little wind (at the Equator)
Poles have higher pressure (cold air) Equator has lower pressure (warmer air) Air sinks from poles Equator creating convection cells 7. Global Convection Currents
The convection currents create a distribution system for earth’s heat http://www.youtube.com/watch?v=QbvHglFyZbg&playnext=1&list=PL9014F9D947576497
8. Why do the winds curve? • The Earth’s rotation curves the global winds. • Right in the Northern hemisphere • Left in the Southern hemisphere • This is called Coriollis Effect. • Coriolis Force: an artifact of the earth's rotation • Observe an animation of the Coriolis effect over Earth's surface.
9. Jet Streams • Jet stream – bands of high speed winds • 200 to 400 kilometers/hour • Up near the Tropopause • Can “stear” weather and pollution patterns http://www.youtube.com/watch?v=CgMWwx7Cll4 http://www.youtube.com/watch?v=UFC6819LS5w&feature=related
Question… • Why do you think there are bands of wet and dry air at the equator, 30o, 60o and 90 o?
10. Wind Chill factor • Wind chill factor – increased cooling, increased evaporation, make the temperature feel colder. The stronger the wind, the colder you feel!
Summary: What affect do winds have on weather? • Moves weather • Creates weather patterns (seasonal changes) c. Increases evaporation (dry things out) d. Creates a wind chill (colder temperatures) http://www.youtube.com/watch?v=kPueXIHGQrg&feature=related http://www.youtube.com/watch?v=fYfrWLhZy1A&feature=related
High: Anticyclone Clockwise, outward More dense Air sinks Good weather Dry air Lows : CyclonesCounter clockwise, inward Less DenseRising airMoist airBad weather High vs. Low Air
Isobars • Isobars are lines on a map that connect areas of equal air pressure. • Same rules apply…. • Connect equal values • Calculate gradient • Steep side where lines are closest together
Pressure gradients • Pressure Gradient - the change in air pressure with distance. • The windiest areas have the steepest gradients. • Calculate the gradient between A – B and C – D on the following map
A D B C
Wind barbs • Tell us direction and speed. The wind is blowing from the southeast at 15-20 mph
Barometric pressure on station models In the plotted station model the 3 digit number to the upper right of the station circle is the barometric pressure. It will look like 196 for pressures 1000 millibars and higher: and 992 for pressures below 1000. So, 196 means 1019.6 mb and 992 means 999.2 mb. Basically, add a 10 in front of anything starting with a 0 or 1, and a 9 for anything starting with a 9. Convert each station and then draw the isobars. 1016, 1012, 1008 and 996, 1004, 1008