Download
1 / 43
480 likes | 1.62k Views
Acid-Base Titrations. Introduction 1.) Experimental Measurements of p K a p K a of amino acids in an active-site of a protein are related to its function Protein structure and environment significantly perturb p K a values

E N D
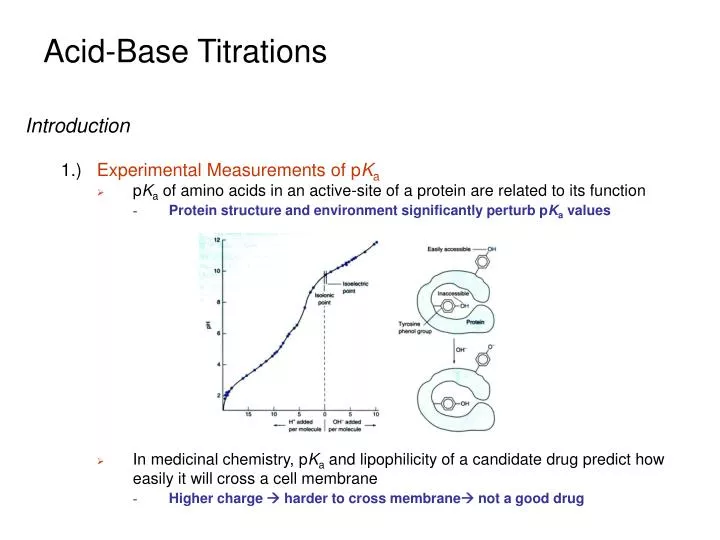
Acid-Base Titrations • Introduction • 1.)Experimental Measurements of pKa • pKa of amino acids in an active-site of a protein are related to its function • Protein structure and environment significantly perturb pKa values • In medicinal chemistry, pKa and lipophilicity of a candidate drug predict how easily it will cross a cell membrane • Higher charge harder to cross membrane not a good drug
Acid-Base Titrations • Introduction • 2.)Example: • impact of the Asp on the pKa of His in the His-Asp catalytic dyad. • Glucose 6-phosphate dehydrogenase (G6PD) catalyzes the oxidation of glucose 6-phosphate using NAD+ or NADP+ • His-240 is the general base that extracts a proton from the C1-OH of G6P The pKa of His-240 in the G6PD apoenzyme is found to be 6.4, which corresponds to an unidentified pKa value of 6.3 that was previously derived from the dependence of kcat on pH. These results suggest that the pKa of His-240 is unperturbed by Asp. Biochemistry, Vol. 41, No. 22, 2002 6945
Acid-Base Titrations • Introduction • 3.)Overview • Titrations are Important tools in providing quantitative and qualitative data for a sample. • To best understand titrations and the information they provide, it is necessary to understand what gives rise to the shape of a typical titration curve. • To do this, acid-base equilibria are used to predict titration curve shapes. proton release from PAA decreases with increase in the degree of dissociation for the highest polymer concentration conformational change of the PAA from rod-like conformation to a random coil form, J. Phys. Org. Chem. 2006; 19: 129–135
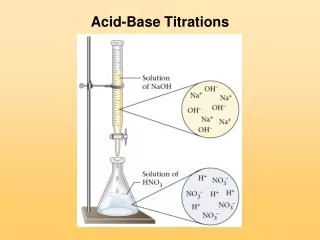
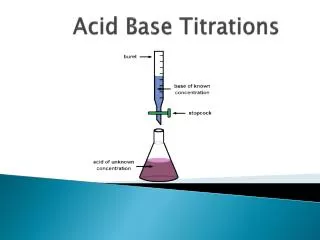
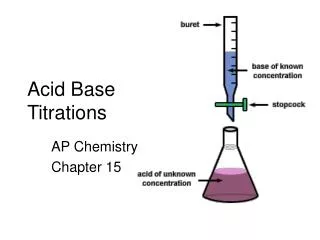
Acid-Base Titrations • Titration of Strong Base with Strong Acid • 1.)Graph of How pH changes as Titrant is Added • Assume strong acid and base completely dissociate • Any amount of H+ added will consume a stoichiometric amount of OH- • Reaction Assumed to go to completion • Three regions of the titration curve • Before the equivalence point, the pH is determined by excess OH- in the solution • At the equivalence point, H+ is just sufficient to react with all OH- to make H2O • After the equivalence point, pH is determined by excess H+ in the solution.
Acid-Base Titrations • Titration of Strong Base with Strong Acid • 1.)Graph of How pH changes as Titrant is Added • Remember, equivalence point is the ideal goal • Actually measure End Point • Marked by a sudden physical change: color, potential • Different Regions require different kinds of calculations • Illustrated examples • The “true” titration reaction is: Titrant Analyte
Acid-Base Titrations • Titration of Strong Base with Strong Acid • 2.)Volume Needed to Reach the Equivalence Point • Titration curve for 50.00 mL of 0.02000 M KOH with 0.1000 M HBr • At equivalence point, amount of H+ added will equal initial amount of OH- mmol of OH- being titrated mmol of HBr at equivalence point When 10.00 mL of HBr has been added, the titration is complete. Prior to this point, there is excess OH- present. After this point there is excess H+ present.
Acid-Base Titrations • Titration of Strong Base with Strong Acid • 3.)Before the Equivalence Point • Titration curve for 50.00 mL of 0.02000 M KOH with 0.1000 M HBr • Equivalence point (Ve) when 10.00 mL of HBr has been added • When 3.00 mL of HBr has been added, reaction is 3/10 complete Initial volume of OH- Calculate Remaining [OH-]: Total volume Fraction of OH- Remaining Initial concentration of OH- Dilution Factor Calculate [H+] and pH:
Acid-Base Titrations • Titration of Strong Base with Strong Acid • 4.)At the Equivalence Point • Titration curve for 50.00 mL of 0.02000 M KOH with 0.1000 M HBr • Just enough H+ has been added to consume OH- • pH determined by dissociation of water • pH at the equivalence point for any strong acid with strong base is 7.00 • Not true for weak acid-base titration Kw Kw= 1x10-14 x x
Acid-Base Titrations • Titration of Strong Base with Strong Acid • 5.)After the Equivalence Point • Titration curve for 50.00 mL of 0.02000 M KOH with 0.1000 M HBr • Adding excess HBr solution • When 10.50 mL of HBr is added Calculate volume of excess H+: Calculate excess [H+]: Volume of excess H+ Initial concentration of H+ Dilution factor Total volume Calculate pH:
Acid-Base Titrations • Titration of Strong Base with Strong Acid • 6.)Titration Curve • Rapid Change in pH Near Equivalence Point • Equivalence point is where slope is greatest • Second derivative is 0 • pH at equivalence point is 7.00, only for strong acid-base • Not True if a weak base-acid is used
Acid-Base Titrations • Titration of Weak Acid with Strong Base • 1.)Four Regions to Titration Curve • Before any added base, just weak acid (HA) in water • pH determined by Ka • With addition of strong base buffer • pH determined by Henderson Hasselbach equation • At equivalence point,all HA is converted into A- • Weak base with pH determined by Kb Ka Kb
K Acid-Base Titrations • Titration of Weak Acid with Strong Base • 1.)Four Regions to Titration Curve • Beyond equivalence point,excess strong base is added to A- solution • pH is determined by strong base • Similar to titration of strong acid with strong base 2.) Illustrated Example: • Titration of 50.00 mL of 0.02000 M MES with 0.1000 M NaOH • MES is a weak acid with pKa = 6.27 • Reaction goes to completion with addition of strong base
Acid-Base Titrations • Titration of Weak Acid with Strong Base 3.) Volume Needed to Reach the Equivalence Point • Titration of 50.00 mL of 0.02000 M MES with 0.1000 M NaOH • Reaction goes to completion with addition of strong base • Strong plus weak react completely mmol of HA mmol of base
Acid-Base Titrations • Titration of Weak Acid with Strong Base 4.) Region 1: Before Base is Added • Titration of 50.00 mL of 0.02000 M MES with 0.1000 M NaOH • Simply a weak-acid problem Ka Ka= 10-6.27 Calculate [H+]: F - x x x Calculate pH:
Acid-Base Titrations • Titration of Weak Acid with Strong Base 5.) Region 2: Before the Equivalence Point • Titration of 50.00 mL of 0.02000 M MES with 0.1000 M NaOH • Adding OH- creates a mixture of HA and A- Buffer • Calculate pH from [A-]/[HA] using Henderson-Hasselbach equation Simply the difference of initial quantities Calculate [A-]/HA]: Simply ratio of volumes Amount of added NaOH is 3 mL with equivalence point is 10 mL Calculate pH:
Acid-Base Titrations • Titration of Weak Acid with Strong Base 5.) Region 2: Before the Equivalence Point • Titration of 50.00 mL of 0.02000 M MES with 0.1000 M NaOH • pH = pKa when the volume of titrant equals ½Ve
Acid-Base Titrations • Titration of Weak Acid with Strong Base 5.) Region 3: At the Equivalence Point • Titration of 50.00 mL of 0.02000 M MES with 0.1000 M NaOH • Exactly enough NaOH to consume HA • The solution only contains A- weak base Kb F - x x x
Acid-Base Titrations • Titration of Weak Acid with Strong Base 5.) Region 3: At the Equivalence Point • Titration of 50.00 mL of 0.02000 M MES with 0.1000 M NaOH Calculate Formal concentration of [A-]: A- is no longer 0.02000 M, diluted by the addition of NaOH Initial volume of HA Initial concentration of HA Dilution factor Total volume
Acid-Base Titrations • Titration of Weak Acid with Strong Base 5.) Region 3: At the Equivalence Point • Titration of 50.00 mL of 0.02000 M MES with 0.1000 M NaOH Calculate [OH-]: Calculate pH: pH at equivalence point is not 7.00 pH will always be above 7.00 for titration of a weak acid because acid is converted into conjugate base at the equivalence point
Volume of excess OH- Initial concentration of OH- Total volume Dilution factor Acid-Base Titrations • Titration of Weak Acid with Strong Base 5.) Region 4: After the Equivalence Point • Titration of 50.00 mL of 0.02000 M MES with 0.1000 M NaOH • Adding NaOH to a solution of A- • NaOH is a much stronger base than A- • pH determined by excess of OH- Calculate volume of excess OH-: Amount of added NaOH is 10.10 mL with equivalence point is 10 mL Calculate excess [OH-]: Calculate pH:
Acid-Base Titrations • Titration of Weak Acid with Strong Base 5.) Titration Curve • Titration of 50.00 mL of 0.02000 M MES with 0.1000 M NaOH • Two Important Features of the Titration Curve Equivalence point: [OH-] = [HA] Steepest part of curve Maximum slope pH=pKa Vb = ½Ve Minimum slope Maximum Buffer Capacity
Acid-Base Titrations • Titration of Weak Acid with Strong Base 5.) Titration Curve • Depends on pKa or acid strength • Inflection point or maximum slope decreases with weaker acid • Equivalence point becomes more difficult to identify weak acid small slope change in titration curve Difficult to detect equivalence point Strong acid large slope change in titration curve Easy to detect equivalence point
Acid-Base Titrations • Titration of Weak Acid with Strong Base 5.) Titration Curve • Depends on acid concentration • Inflection point or maximum slope decreases with lower acid concentration • Equivalence point becomes more difficult to identify • Eventually can not titrate acid at very low concentrations High concentration large slope change in titration curve Easy to detect equivalence point Low concentration small slope change in titration curve Difficult to detect equivalence point At low enough concentration, can not detect change
Acid-Base Titrations • Titration of Weak Base with Strong Acid 1.) Simply the Reverse of the Titration of a Weak Acid with a Strong Acid • Again, Titration Reaction Goes to Completion: • Again, Four Distinct Regions to Titration Curve • Before acid is added just weak base reaction • pH determined from Kb • Before equivalence point, buffer • pH determined from Henderson Hasselbach equation • Va=½Ve then pH = pKa (for BH+) • pKa and pKb can be determined from titration curve Kb F - x x x
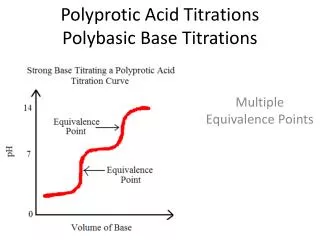
Acid-Base Titrations • Titration in Diprotic Systems 1.) Principals for Monoprotic Systems Apply to Diprotic Systems • Multiple equivalence points and buffer regions • Multiple Inflection Points in Titration Curve Two equivalence points Kb1 Kb2
Acid-Base Titrations • Titration in Diprotic Systems 2.) A Typical Case • Titration of 10.0 mL of 0.100 M base (B) with 0.100 M HCl • pKb1 = 4.00 and pKb2 = 9.00 • Volume at First Equivalence Point (Ve) • Volume at Second Equivalence Point Must Be2Ve • Second reaction requires the same number of moles of HCl mmol of B mmol of HCl
Acid-Base Titrations • Titration in Diprotic Systems 2.) A Typical Case • Point A • Before Acid Added • Weak base problem Kb1 0.100 - x x x
Acid-Base Titrations • Titration in Diprotic Systems 2.) A Typical Case • Point between A &B • Before First Equivalence Point • Buffer problem Point (1.5 mL) is before first equivalence point (10 mL)
Acid-Base Titrations • Titration in Diprotic Systems 2.) A Typical Case • Point B • Before First Equivalence Point • Buffer problem Point B (5 mL) is halfway to first equivalence point (10 mL) pH = pKa2=10.00
Acid-Base Titrations • Titration in Diprotic Systems 2.) A Typical Case • Point C • First Equivalence Point • Intermediate form of the Diprotic acid Account for dilution for formal concentration (F) of BH+ Solve for pH using intermediate form equation Initial volume of B Initial concentration of B Total volume Dilution factor
Acid-Base Titrations • Titration in Diprotic Systems 2.) A Typical Case • Point D • Before Second Equivalence Point • Buffer Problem Point D (15 mL) is halfway to second equivalence point (2x10 mL). First, subtract Ve (10 mL) pH = pKa1=5.00
Acid-Base Titrations • Titration in Diprotic Systems 2.) A Typical Case • Point E • Second Equivalence Point • Weak acid problem Account for dilution for formal concentration (F) of BH2+2 Initial volume of B Initial concentration of B Total volume Dilution factor pH determined by acid dissociation of BH2+2 Kb2
Acid-Base Titrations • Titration in Diprotic Systems 2.) A Typical Case • Point E • Second Equivalence Point • Weak acid problem Ka1 0.0333 - x x x
Acid-Base Titrations • Titration in Diprotic Systems 2.) A Typical Case • Beyond Point E • Past Second Equivalence Point • Strong acid problem pH from volume of strong acid added. Addition of 25.00 mL: Excess acid: Concentration of H+: pH:
Acid-Base Titrations • Titration in Diprotic Systems 3.) Blurred End Points • Two or More Distinct Equivalence Points May Not be Observed in Practice • Depends on relative difference in Kas or Kbs • Depends on Relative strength of Kas or Kbs Only one Equivalence point is clearly evident Second Ka is too strong and is not a weak acid relative to titrant
Acid-Base Titrations • Titration in Diprotic Systems 4.) Using Derivatives to Find End Point • Useful when End points overlap • End Point of titration curve is where slope is greatest • dpH/dV is large • DpH change in pH between consecutive points • DV average of pair of volumes • Second derivative is similar difference using first derivative values End point: 2nd derivative is zero End point: 1st derivative is maximum Dph = 4.400-4.245=0.155
Acid-Base Titrations • Titration in Diprotic Systems 5.) Using Gran Plot to Find End Point • Method of Plotting Titration Data to Give a Linear Relationship • A graph of Vb10-pH versus Vb is called a Gran plot where: Vb = volume of strong base added Ve = volume of base needed to reach equivalence point gA-, gHA = activity coefficients ≈ 1
Acid-Base Titrations • Titration in Diprotic Systems 5.) Using Gran Plot to Find End Point • Plot is a straight line • If ratio of activity coefficients is constant • Slope = -KagHA/ga- • X-intercept = Ve (must be extrapolated) • Measure End Point with data Before Reach End Point • Only use linear region of Gran Plot • Changing ionic strength changes activity coefficients • added salt to maintain constant ionic strength Slope Gives Ka x-intercept gives Ve Never Goes to Zero, approximation that every mole of OH- generates one mole of A- is not true as Vb approaches Ve
Acid-Base Titrations • End Point Determination 1.) Indicators: compound added in an acid-base titration to allow end point detection • Common indicators are weak acids or bases • Different protonated species have different colors
Acid-Base Titrations • End Point Determination 1.) Indicators: compound added in an acid-base titration to allow end point detection • Color Change of Thymol Blue between pH 1 and 11 pK = 8.9 pK = 1.7
Acid-Base Titrations • End Point Determination 2.) Choosing an Indicator • Want Indicator that changes color in the vicinity of the equivalence point and corresponding pH • The closer the two match, the more accurate determining the end point will be Bromocresol purple color change brackets the equivalence point and is a good indicator choice Bromocresol green will change color Significantly past the equivalence point resulting in an error.
Acid-Base Titrations • End Point Determination 2.) Choosing an Indicator The difference between the end point (point of detected color change) and the true equivalence point is the indicator error Amount of indicator added should be negligible Indicators cover a range of pHs
Acid-Base Titrations • End Point Determination 3.) Example: a) What is the pH at the equivalence point when 0.100 M hydroxyacetic acid is titrated with 0.0500 M KOH? b) What indicator would be a good choice to monitor the endpoint?