Download
1 / 21
330 likes | 987 Views
ROBUST DESIGN. Dr. Genichi Taguchi. Widely acknowledged leader in the U.S. industrial quality movement Credited for starting the “Robust Design” movement in Japan in 1950’s Helped correct postwar Japan's telephone system 1980 introduced Taguchi method to AT&T

E N D
Dr. Genichi Taguchi • Widely acknowledged leader in the U.S. industrial quality movement • Credited for starting the “Robust Design” movement in Japan in 1950’s • Helped correct postwar Japan's telephone system • 1980 introduced Taguchi method to AT&T • Taguchi said Ideal Quality is delivered when “a product or service performs its intended function throughout its projected life under reasonable operating conditions without harmful side effects.”
Cont. • Taguchi’s contributions include: • The Taguchi loss function ( This involves the quality lost during the process ) • Robust design ( creating an insensitive design towards uncontrollable variables • Off‑line and on‑line quality control
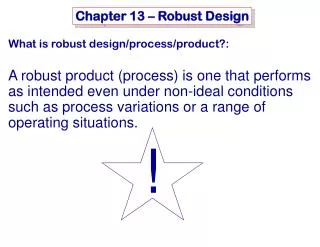
Robust Design • It focuses on improving the fundamental function of the product or process, thus facilitating flexible designs and concurrent engineering to minimally impacted by external forces, such as environment,operating, or manufacturing conditions. • It is the most powerful method available to reduce product cost, improve quality, and simultaneously reduce development interval • It used in diverse industries: automobiles, xerography, telecommunications, electronics, software, etc
Steps In Creating Robust Design Step 1 : Problem Formulation Step 2 : Data Collection/Simulation Step 3 : Factor Effects Analysis Step 4 : Prediction/Confirmation
Steps In Creating Robust Design (cont.) Step 1 : Problem Formulating This Steps Include : 1. Developing P-Diagram 2. Defining Ideal Function and S/N Ratio. 3. Planning Experiments
Step 1 (Cont.) : 1.Parameter Diagram (P-Diagram) It used to identify signal (input), response (output), noise factor (factors that are beyond the control of the design), control factors (factors that can be specified by the designer). Noise factors may include: – parameter variations – environmental changes – operating conditions – manufacturing variations
Example : Brownie Mix • Controllable Input Parameters – Recipe Ingredients (quantity of eggs, flour, chocolate) – Recipe Directions (mixing, baking, cooling) – Equipment (bowls, pans, oven) • Uncontrollable Noise Factors – Quality of Ingredients (size of eggs, type of oil) – Following Directions (stirring time, measuring) – Equipment Variations (pan shape, oven temp) • Measurable Performance Response – Taste Testing by Customers – Sweetness, Moisture, Density
Step 1 (cont.) : • Ideal Function & S/N Ratio • The ideal function is a function that govern all engineering system, it’s graph represents the performance target for the engineered system • Define an objective function (of the response) to optimize. • maximize desired performance • minimize variations • quadratic loss • signal-to-noise ratio
Ideal Function & S/N Ratio (cont.) • The general form of ideal function is given below. y = b M where, y = the output response, M = input signal and b = slope of the line. • Sensitivity The slope b of the ideal function equation is called sensitivity. Though higher sensitivity is desired, one has to be careful because higher sensitivity sometimes may cause problems.
Ideal Function & S/N Ratio (cont.) • Noise factors are parameters that are uncontrollable, or have high impact on the cost. Ex : Driving habits, road conditions, temperature, humidity, deterioration etc. • And signal is a variable that user expects to have a certain change in the output response as designed to. Ex : Force applied on brake pressure, cutting force, rotation of steering wheel etc.
Ideal Function & S/N Ratio (cont.) • S/N = (Intended output) / (Unintended output) = (What we want) / (What we don't want) = (Useful energy) / (Waste energy) • The purpose is to optimize the S/N ratio according to the situation that is involved.
Type Of S/N Ratio : (a) Smaller-the-better f(y) = 1/y2 For example : variance, the number of flaws in the paint on an automobile (b) Nominal-the-best f(y) = 10 * log10 (Mean2/Variance) This signal-to-noise ratio could be used whenever ideal quality is equated with a particular nominal value. For example: target, the size of piston rings for an autotomobile engine must be as close to specification as possible to ensure high quality.
Type Of S/N Ratio (cont.) : (c) Larger-the-better f(y) = y2 Examples of this type of engineering problem are performance, fuel economy (miles per gallon) of an automobile,strength of concrete, resistance of shielding materials, etc. (d) Signed Target Eta = -10 * log10(variance) for i = 1 to no. vars variance of the quality characteristic across the measurements (variables). Used when the quality characteristic of interest has an ideal value of zero.
Type Of S/N Ratio (cont.) : e) Fraction Defective Eta = -10 * log10[p/(1-p)] where p is the proportion defective This S/N ratio is useful for minimizing scrap, minimizing the percent of patients who develop side-effects to a drug, etc.
Step 1 (cont.) : 3. Planning the Experiment. • Vary the input and noise parameters • Record the output response • Compute the objective function Goals for Planning Experiments : a. Understanding relationships between design parameters and product performance b. Understanding effects of noise factors c. Reducing product or process variations
Steps In Creating Robust Design (cont.) Step 2 : Data Collection / Simulation The Experiments may be conducted in hardware or simulation. Its more desireable to have an essential model of the product that adequately captures the disegn concept. Thus, the experiments can e done more economically Step 3 : Factor Effects Analysis In this step, the effect of the control factor are calculated and the result are analyzed to select optimum setting of the control factors.
Steps In Creating Robust Design (cont.) Step 4 : Prediction / Confirmation To validate the optimum condition we predict the performance of the product/process design under baseline and optimum settings of the control factors. Then we perform confirmation Then we perform confirmation experiments under these conditions and compare the results with the predictions. If the results of confirmation experiments agree with the predictions, then we implement the results. Otherwise, the above steps must be iterated
Robust Design enables engineers to : • Develop products and processes which perform consistently as intended under a wide range of user's conditions throughout their life cycle (durable and reliable) • Maximize robustness-improve the intended function of the product by developing and increasing insensitivity to noise factors which tend to degrade performance • Develop or change product formulas and process settings to achieve desired performance at the lowest cost and in the shortest time • Simplify designs and processes to reduce cost
References : Taguchi, Genichiand Clausing, Don “Robust Quality” Harvard Business Review, Jan-Feb 1990. Byrne, Diane M. and Taguchi, Shin “The Taguchi Approach to Parameter Design” Quality Progress, Dec 1987. Phadke, MadhavS. Quality Engineering Using Robust Design Prentice Hall, Englewood Cliffs, 1989. Ross, Phillip J. Taguchi Techniques for Quality Engineering McGraw-Hill, New York, 1988. http://www.isixsigma.com http://www.statsoft.com/textbook/stexdes.html#taguchi