Download
1 / 27
270 likes | 374 Views
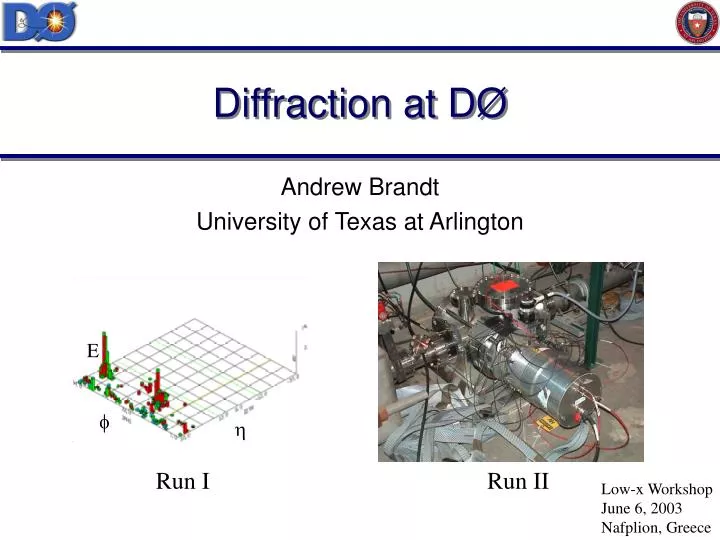
E. f. h. Diffraction at DØ. Andrew Brandt University of Texas at Arlington. Run I. Run II. Low-x Workshop June 6, 2003 Nafplion, Greece. Examples of Soft Diffraction. Modeled by Regge Theory Non-perturbative QCD No quantum number exchanged

E N D
E f h Diffraction at DØ Andrew Brandt University of Texas at Arlington Run I Run II Low-x Workshop June 6, 2003 Nafplion, Greece
Examples of Soft Diffraction • Modeled by Regge Theory • Non-perturbative QCD • No quantum number exchanged • Synonymous with exchange of a Pomeron
Examples of Hard Diffraction • Described by Different Models • Ingelman-Schlein based (q/g partonic structure of Pomeron) • BFKL-based (gluon ladder structure of Pomeron) • Soft Color Interactions (non-perturbative effects of standard QCD) Diffractively Produced Jets Diffractively Produced W
DØ Detector (Run I) (nl0 = # tiles in L0 detector with signal 2.3 < |h| < 4.3) Central Gaps EM Calorimeter ET > 200 MeV |h| < 1.0 Forward Gaps EM Calorimeter E > 150 MeV 2.0 < || < 4.1 Had. Calorimeter E > 500 MeV 3.2 < || < 5.2) beam L0 Detector End Calorimeter Central Calorimeter EM Calorimeter Central Drift Chamber (ntrk = # charged tracks with |h| < 1.0) Hadronic Calorimeter (ncal = # cal towers with energy above threshold)
Data Samples Central and forward electron W boson sample: Start with Run1b W en candidate sample Z boson sample: Start with Run1b Z ee candidate sample
Multiplicity in W Boson Events Minimum side -2.5 -1.5 0 1.1 3.0 5.2 Plot multiplicity in 3<||<5.2 DØ Preliminary Peak at (0,0) indicates diffractive W boson signal (91 events)
W Boson Event Characteristics ET=35.2 ET=35.1 ET=36.9 ET=37.1 MT=70.4 MT=72.5 Standard W Events Diffractive W Candidates DØ Preliminary
Observation of Diffractive W/Z • Observed clear Diffractively produced W and Zbosonsignals • Background from fake W/Z gives negligible change in gap fractions Diffractive W and Z Boson Signals nL0 ncal nL0 ncal Central electron W Forward electron W DØ Preliminary Sample Diffractive Probability Background All Fluctuates to Data Central W (1.08 + 0.19 - 0.17)% 7.7s Forward W (0.64 + 0.18 - 0.16)% 5.3s All W(0.89 + 0.19 – 0.17)% 7.5s All Z (1.44 + 0.61 - 0.52)% 4.4s nL0 ncal All Z
W/Z Cross Section Ratio RD = (WD )/ ( ZD ) = R*(WD/W)/ (ZD/Z) where WD/W and ZD/Z are the measured gap fractions from this letter and R=(W)/ (Z) = 10.43 ±0.15 (stat) ±0.20 (sys)±0.10 (NLO) B. Abbott et al. (D0 Collaboration), Phys. Rev D 61, 072001 (2000). Substituting in these values gives RD = 6.45 + 3.06 -2.64 This value of RD is somewhat lower than, but consistent with, the non-diffractive ratio. DØ Preliminary
Diffractive W Boson x Etieyi/2E data@ S Calculate x = Dp/p for W boson events using calorimeter: • Sum over all particles in event: those • with largest ET and closest to gap given • highest weight in sum (particles lost • down beam pipe at –h do not contribute • Use only events with rapidity gap • {(0,0) bin} to minimize • non-diffractive background • Correction factor 1.5+-0.3 derived • from MC used to calculated data x DØ Preliminary
DØ/CDF Comparison CDF {PRL 78 2698 (1997)} measured RW = (1.15 ± 0.55)%for ||<1.1 where RW = Ratio of diffractive/non-diffractive W (a significance of 3.8) We measured (1.08 +0.19 –0.17)% for ||<1.1 No problem right? Well… CDF corrects data for gap acceptance using MC and get 0.81 correction, so get an uncorrected value (0.93 ± 0.44)% , which is still consistent with our uncorrected data value. Our measured gap acceptance is (21 ± 4)%, so our corrected value is 5.1%!! Comparison of other gap acceptances for central objects from CDF and DØ using 2-D method:DØ central jets 18% (q) 40%(g) CDF central B 22%(q) 37% overall CDF J/ 29% It will be interesting to see Run II diffractive W boson results!
DØ Run II Diffractive Topics E Soft Diffraction and Elastic Scattering: Inclusive Single Diffraction Elastic scattering (t dependence) Total Cross Section Centauro Search Inclusive double pomeron Search for glueballs/exotics Hard Diffraction: Diffractive jet Diffractive b,c ,t , Higgs Diffractive W/Z Diffractive photon Other hard diffractive topics Double Pomeron + jets Other Hard Double Pomeron topics Rapidity Gaps: Central gaps+jets Double pomeron with gaps Gap tags vs. proton tags Topics in RED were studied with gaps only in Run I <100 W boson events in Run I, >1000 tagged events expected in Run II
Run II Rapidity Gap System • Use signals from Luminosity Monitor (and later Veto Counters) to trigger on rapidity gaps with calorimeter towers for gap signal • Use calorimeter at Level 2 to further refine rapidity gaps VC: 5.2 < h < 5.9 LM: 2.5 < h < 4.4
Calorimeter Energy for Gap Triggers E South LM Veto North E North LM Veto North DØ Preliminary E North LM Veto South E South LM Veto South Trigger on gap in Luminosity Monitor (LM) + two 25 Gev jets; Sum EM energy DØ Preliminary
Leading Jet ET Inclusive Jets North Gap Jets ET (GeV) ET (GeV) South Gap Jets Double Gap Jets ET (GeV) ET (GeV) DØ Preliminary
Forward Proton Detector Layout p p • 9 momentum spectrometers comprised of 18 Roman Pots • Scintillating fiber detectors can be brought close (~6 mm) to the beam to track scattered protons and anti-protons • Reconstructed track is used to calculate momentum fraction and scattering angle • Much better resolution than available with gaps alone • Cover a t region (0 < t < 4.5 GeV2) never before explored at Tevatron energies • Allows combination of tracks with high-pT scattering in the central detector P1U P2O Q4 Q3 Q2 Q2 S D Q3 Q4 S A1 D1 A2 D2 P1D P2I Veto 57 59 23 0 33 23 33 Z(m)
FPD Detector Setup • 6 planes per detector in 3 frames and a trigger scintillator • U and V at 45 degrees to X, 90 degrees to each other • U and V planes have 20 fibers, X planes have 16 fibers • Planes in a frame offset by ~2/3 fiber • Each channel filled with four fibers • 2 detectors in a spectrometer 17.39 mm V’ V Trigger X’ X U’ U 17.39 mm 1 mm 0.8 mm 3.2 mm
Tagged Elastic Trigger A1U A2U Pbar P P1D P2D LM • Approximately 3 million elastic events recorded • About 1% (30,000) pass multiplicity cuts • Multiplicity cuts used for ease of reconstruction and to remove halo spray background from Tevatron • 1 or 0 hits in each of 12 planes of the PD spectrometer • Each frame of both PD detectors needs a valid segment (i.e. 6 segments total) • Segments turned into hits and then reconstructed into tracks VC Halo Early Hits NO HITS INLMNORLMS ORVCNORVCS NO EARLY HALO HITS IN A1U-A2U, P1D-P2D IN TIME HITS IN A1U-A2U, P1D-P2D
Combination of fibers in a frame determine a segment Need two out of three possible segments to get a hit U/V, U/X, V/X Can reconstruct an x and y Can also get an x directly from the x segment Require a hit in both detectors of spectrometer Segments to Hits y x 10 Segments (270 m) v u x
Initial Reconstruction P1D beam Y Reconstructed X DØ Preliminary P2D beam Y =p/p should peak at 0 for elastic events!! Dead Fibers due to cables that have since been fixed
Spectrometer Alignment P1D x vs. P1D x (mm) P1D y vs. P2D y (mm) • Good correlation in hits between detectors of the same spectrometer but shifted from kinematic expectations • 3mm in x and 1 mm in y DØ Preliminary
Elastic Data Distributions After alignment correction, x peaks at 0(as expected for elastics); MC x resolution is 0.013 (including z smearing and dead channels), data is 0.015, 1.15 times larger The t distribution has a minimum of 0.8 GeV2; tmin is determined by how close the pots are from the beam, shape is in rough agreement with expected angular acceptance from MC. Before alignment After alignment Gaussian fit t distribution DØ Preliminary
TDC Timing from Trigger PMTs tp – tp = 18ns TOF: 197ns 190ns From TDCs : 18ns = (396ns – L1/c) – L1/c 4ns = (396ns – L2/c) – L2/c L1 = 56.7 m; L2 = 58.8 m DØ Preliminary tp – tp = 4ns Tevatron Lattice: L1 = 56.5m; L2 = 58.7m
TDC Resolution • Can see bunch structure of both proton and antiproton beam • Can reject proton halo at dipoles using TDC timing pbar D2 TDC p DØ Preliminary D1 TDC
Summary and Future Plans • Run II analysis still in early stages • Early FPD stand-alone analysis shows that detectors work • FPD is now integrated into DØ readout • Commissioning of FPD and trigger in progress • Definition of rapidity gaps in Run II detector underway • Tune in next year for first FPD physics results