Download
1 / 10
100 likes | 276 Views
Comparative Advantage. Trade-offs and Trade Fall 2013. Production Possibilities for Two Castaways. (a) Tom’s Production Possibilities. 30. Quantity of coconuts. 9. 0. 28. 40. Quantity of fish. Production Possibilities for Two Castaways. (a) Hank’s Production Possibilities.

E N D
Comparative Advantage Trade-offs and Trade Fall 2013
Production Possibilities for Two Castaways (a) Tom’s Production Possibilities 30 Quantity of coconuts 9 0 28 40 Quantity of fish
Production Possibilities for Two Castaways (a) Hank’s Production Possibilities Quantity of coconuts 20 8 Hank’s PPF 0 6 10 Quantity of fish
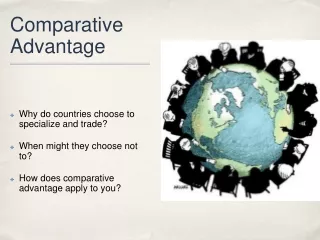
Specialize and Trade • Both castaways are better off when they each specialize in what they are good at and trade. • This is true of countries as well – and it is related to the concept of comparative advantage.
Comparative Advantage and Gains from Trade (a) Tom’s Production and Consumption (b) Hank’s Production and Consumption Quantity of coconuts Quantity of coconuts 30 Tom’s consumption without trade Hank’s production with trade Tom’s consumption with trade 20 Hank’s consumption with trade Tom’s production with trade Hank’s consumption without trade 10 10 9 8 Hank's T o m 's PPF PPF 0 6 10 0 28 30 40 Quantity of fish Quantity of fish
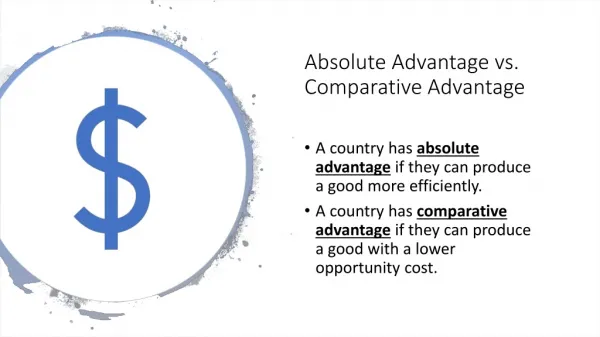
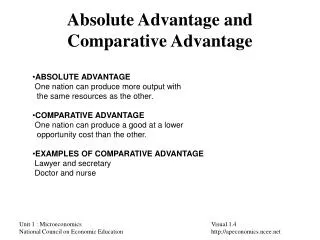
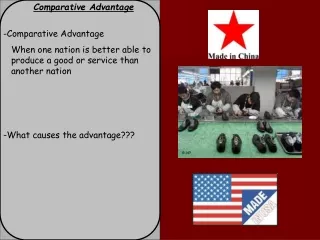
II. Absolute vs. Comparative Advantage • Absolute advantage: Greater total output • Comparative Advantage: Opportunity cost for producing something is lower for one person (or country) than the other.
III. The Circular-Flow Diagram • Model that represents the transactions in an economy by flows around a circle.
The Circular-Flow Diagram Money Households Money Goods Factors and services Markets for goods and services Factor Markets Goods and Factors services Firms Money Money