Download
1 / 32
320 likes | 578 Views
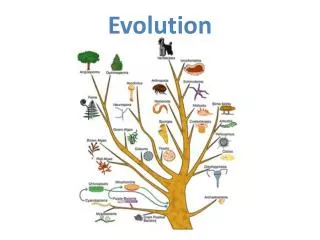
Evolution. The process of change in the genetic makeup of populations. The basis of the change is change in gene frequencies over time. How the frequency of a mutant allele change in time under various evolutionary forces. Population.

E N D
Evolution • The process of change in the genetic makeup of populations. • The basis of the change is change in gene frequencies over time. • How the frequency of a mutant allele change in time under various evolutionary forces.
Population • A population is any group of members of the same species in a given geographical area. • Gene pool refers to the collection of all alleles in the members of the population. • Population genetics refers to the study of the genetics of a population and how the alleles vary with time.
Allele Frequencies • # of particular allele /total # of alleles • count both chromosomes of each individual • Allele frequencies affect the genotype frequencies or the frequency of each type of homozygote and heterozygote in the population.
Fixation of an allele: • An allele must increase in frequency and ultimately become fixed in the population (all individuals have the same allele). • Fitness: of a genotype, a measure of individual’s ability to survive and reproduce (it is rather relative with respect to other individuals).
Allele frequencies can change creating microevolution Conditions in which allele frequencies can change: • Individuals of one genotype reproduce more often with each other • Individuals migrate between populations • Population size is small or a group becomes reproductively isolated within a larger population • Mutation introduces new alleles or new copies of alleles • Individuals with a particular genotype are more likely to have viable, fertile offspring (negative, neutral, or positive selection) Nonrandom mating Migration Genetic drift Mutation Selection
Hardy-Weinberg Equilibrium • A condition in which allele frequencies remain • constant is called Hardy-Weinberg equilibrium
All of the allele frequencies together equals 1 or the whole collection of alleles All of the genotype frequencies together equals 1 Hardy-Weinberg Equilibrium • A condition in which allele frequencies remain • constant is called Hardy-Weinberg equilibrium p + q = 1 p allele frequency of one allele q allele frequency of a second allele p2 + 2pq + q2 = 1 p2 andq2 genotype frequencies for each homozygote 2pq genotype frequency for heterozygotes
Gamete frequencies .49 .21 .21 .09 Frequency D gamete= .7 frequency d gamete = .3 Hardy-Weinberg Equilibrium Generation 1 p allele frequency of D normal finger length = .7 q allele frequency of d short middle finger = .3 Genotype frequencies DD p2 = (.7)2 = .49 Dd 2pq = 2 (.7)(.3) = .42 dd q2 = (.3)2= .09
Male gametes d q=.3 D p=.7 Female gametes D p=.7 d q=.3 Hardy-Weinberg Equilibrium Generation 1 p allele frequency of D normal finger length = .7 q allele frequency of d short middle finger = .3 Frequency D gamete= .7 frequency d gamete = .3 DD p2=.49 Dd pq=.21 Dd pq=.21 dd q2=.09
q2 = .0005 = q2 = .022 = 1 - q = .977 1 in 23 Application of Hardy-Weinberg Equilibrium:calculating risk Risk of being a carrier of cystic fibrosis for an Caucasian American depends upon Frequency of disease in population = 1 / 2000 Frequency of CF disease allele = q Frequency of wildtype CF allele = p p + q = 1, so Frequency of being heterozygote = 2pq = 2 (.977)(.022) = .043
How to calculate p and q from genotypic frequencies: • If you don’t know p and q, but you can distinctly identify homozygotes from heterozygotes, then p: • (2 times # of homozygotes + number of heterozygotes)/2N • If you don’t know p and q, but you know (p2+2pq) and q2; then assume equilibrium and calculate q from q2: • q = square root of q2 • p = 1-q
All of the women in the population All of the men in the population Application of Hardy-Weinberg Equilibrium:calculating risk with X-linked traits p2 + 2pq + q2 = 1 Females: Males: p + q = 1 Hemophilia is X-linked and occurs in 1 in 10,000 males p= 1/10,000 = .0001 q= .9999 Carrier females = 2pq = 2 (.0001) (.9999) = .0002 1 in 5000 are carriers Affected females = p2 = (.0001) 2 = .00000001 1 in 100 million women will have hemophilia
Application of Hardy-Weinberg Equilibrium:DNA identification SNPs or Single nucleotide polymorphisms Single base differences between chromosomes Repeated sequences Variation in the number of repeats present Variation in DNA sequences outside of genes are subject to Hardy-Weinberg equilibrium. Noncoding variation is useful as it is not subject to as many impacts that lead to deviations in H-W equilibrium namely selection and assortative mating.
Application of Hardy-Weinberg Equilibrium:DNA identification
Application of Hardy-Weinberg Equilibrium:DNA identification
Migration • Changes in allele frequency can be mapped across geographical or linguistic regions. • Allele frequency differences between current populations can be correlated to certain historical events.
Mapping a trait geographically can suggest patterns of migration Frequencies of galactokinase deficiency decrease westward from Bulgaria. Gradients in allele frequencies between successive neighboring populations are called clines.
Genetic variation in space and time & natural variation in populations: • Genetic structure of populations and frequency of alleles varies in space or time. • Allele frequency cline = • allele frequencies change • in a systematic way • geographically. Fig. 22.6, Allele frequency clines in the blue mussel.
Genetic Drift Events that create small populations enhance the effect of genetic drift. Founding a new population Bottlenecks (natural disaster, famine) Geographic separation (islands)
Genetic drift A population bottleneck occurs when a large population is drastically reduced in size. Rebounds in population size occur with descendants of a limited number of survivors.
Genetic drift: • Chance alone may result in changes in allele frequency, including fixation and extinction. • Genetic drift is analogous to sampling effect. • Genetic drift has important consequences for small populations. • Example: • Island population of 10 individuals; 5 with brown eyes (BB) and 5 with green eyes (bb); f(B) = 0.5, f(b) = 0.5. • Typhoon devastates the island; 5 people with brown eyes (BB) die. • Allelic frequency of b , f(b) = 1.0; chance events have radically changed the allele frequencies and the population evolves. • Now imagine the same scenario for an island of 10,000 inhabitants.
Genetic drift: • Chance deviations from expected ratios of gametes and zygotes also produce genetic drift. • Cross Aa x aa expect 50% Aa and 50% aa, but not all of the time insofar that sampling is limited (sampling error). • Sampling variance: sp2 = pq/2N • *N = number of individuals in the population. • Variance is large for small populations, and small for large populations.
Effective population size (Ne) • When number of males and females are not equal, the Ne is: • Ne = (4 x Nf x Nm)/(Nf + Nm), where Nf and Nm are breeding females and males, respectively. • If Nf = 36 and Nm = 36, Ne equals Ntotal: • Ne = (4 x 36 x 36)/(36+36) = 72 • If Nf = 70 and Nm = 2: • Each male contributes ½ x ½ = 0.25 of the alleles to the next generation (both males 0.5 of all alleles) • Each female contributes ½ x 1/70 = 0.0071 of all alleles. • Ne = (4 x 70 x 2)/(70+2) = 7.8 (~8 breeding adults).
Sampling variance of p • Remember sampling variance: • sp2 = pq/2N • Consider unequal number of breeding males and females: • sp2 = pq/2Ne • Standard error: sp = √pq/2Ne • 95% confidence limit = p 2sp
Buri’s study of genetic drift in Drosophila • Actual data for 107 experimental populations. • Randomly selected 8 males and 8 females (N = 16) from each population for the next generation for 19 consecutive generations. • Calculated the frequency of bw75 allele, and generated a frequency distribution among 107 populations.
Mutation Allele frequencies change in response to mutation. Mutation can introduce new alleles. Mutation can convert one allele to another. Mutation has a minor impact unless coupled with another effect (small population size, selection). Selection acts to eliminate deleterious alleles. • Dominant deleterious alleles disappear quickly. • Recessive deleterious alleles are eliminated when homozygotes appear and fail to reproduce. • The collection of recessive deleterious alleles present in a population is called the genetic load.
Mutation: • Heritable changes within DNA. • Source of all truly new genetic variation. • Raw material for evolution. • Mutation rate varies between loci and among species: • ~10-4 to 10-8 mutations/gene/generation. • Mutation rate is abbreviated . • Some mutations are neutral (no effect on reproductive fitness). • Others are detrimental or lethal (depends on environment). • If population size is large, effects of mutation act slowly.
Mutation: • Irreversible mutation: • Allele A is fixed (p =1.0) and mutates A a at rate of = 10-4: Hartl & Clark (1997) Principles of Population Genetics
Fig. 22.3, Frequencies of genotypes AA, Aa, and aa relative to the frequencies of alleles A and a in populations at Hardy-Weinberg equilibrium. Max. heterozygosity @ p = q = 0.5