Download
1 / 5
50 likes | 159 Views
Supplementary Figures. 25. A. 20. SV1. HepG2. Hep3B. HuH-7. SV2. IHH. 15. SV3. Percentage of SV mRNA / KLF6. 900 bp-. - KLF6 869 bp. 800 bp-. 10. 700 bp-. SV2 743 bp. SV3 745 bp. 600 bp-. SV1 715 bp. 5. 0. IHH. HuH-7. Hep3B. HepG2. B. 2.5. 2.5. 2.0. 2.0. 1.5.

E N D
Supplementary Figures 25 A 20 SV1 HepG2 Hep3B HuH-7 SV2 IHH 15 SV3 Percentage of SV mRNA / KLF6 900 bp- - KLF6 869 bp 800 bp- 10 700 bp- SV2 743 bp SV3 745 bp 600 bp- SV1 715 bp 5 0 IHH HuH-7 Hep3B HepG2 B 2.5 2.5 2.0 2.0 1.5 1.5 p53 mRNA expression (2exp(-DDCt)) p53 mRNA expression (2exp(-DDCt)) 1.0 1.0 0.5 0.5 0 0 IHH-SV2 HepG2 IHH-GFP IHH-KLF6 HepG2-SV2 C HepG2-SV2 IHH-KLF6 IHH-GFP IHH-SV2 HepG2 105 kDa- 105 kDa- MDM 2 MDM2 75 kDa- 75 kDa- 50 kDa- 50 kDa- b-Actin b-Actin 37 kDa- 37 kDa-
100 Hep3B 80 60 Counts 40 20 0 0 200 400 600 800 1000 Propidium Iodide D 4.5 4 Hep3B Hep3B-SV2 3.5 3 2.5 Cell proliferation 2 1.5 1 0.5 0 0 24h 48h 72h Time E 100 Hep3B-SV2 80 GO/G1 GO/G1 60 Sub-G1 Sub-G1 Counts S S 40 G2/M G2/M 20 0 0 200 400 600 800 1000 Propidium Iodide 60 Hep3B 50 Hep3B-SV2 40 Percentage of cells 30 20 10 0 Sub-G1 GO/G1 S G2/M
F 10 9 8 7 6 5 SV2 / KLF6 ratio in HCC compared to ST 4 3 2 1 0 1 2 3 4 5 6 7 8 9 10 11 12 13 14 15 16 18 19 20 21 22 23 24 25 26 27 28 29 G N.S. N.S. N.S. 3.0 2.5 2.0 KLF6 mRNA expression (2exp(-DCt)) 1.5 1.0 0.5 0 Normal (n=5) Cirr (n=28) HCC (n=30) H 17.0 15.0 13.0 11.0 9.0 7.0 5.0 3.0 2.0 KLF6 mRNA expression (fold change in HCC vs surrounding tissue) 1.8 1.6 1.4 1.2 1.0 0.8 0.6 0.4 0.2 0 10 15 20 18 21 14 6 23 9 24 19 28 11 3 8 2 13 1 25 26 4 7 12 22 16 27 5 29
I 4 3 SV1 / KLF6 ratio in HCC compared to ST 2 1 0 1 2 3 4 5 6 7 8 9 10 11 12 13 14 15 16 18 19 20 21 22 23 24 25 26 27 28 29 * 0.30 * N.S. 0.25 0.20 SV1 mRNA expression (2exp(-DCt)) 0.15 0.10 0.05 0 Normal (n=5) Cirr (n=28) HCC (n=30) J N.S. 2.5 2.5 N.S. N.S. N.S. 2.0 2.0 N.S. N.S. 1.5 1.5 SV3 mRNA expression (2exp(-DDCt)) SV1 mRNA expression (2exp(-DDCt)) 1.0 1.0 0.5 0.5 0 0 HepG2 HepG2 IHH-SV2 IHH-SV2 IHH-GFP IHH-GFP IHH-KLF6 IHH-KLF6 HepG2-SV2 HepG2-SV2
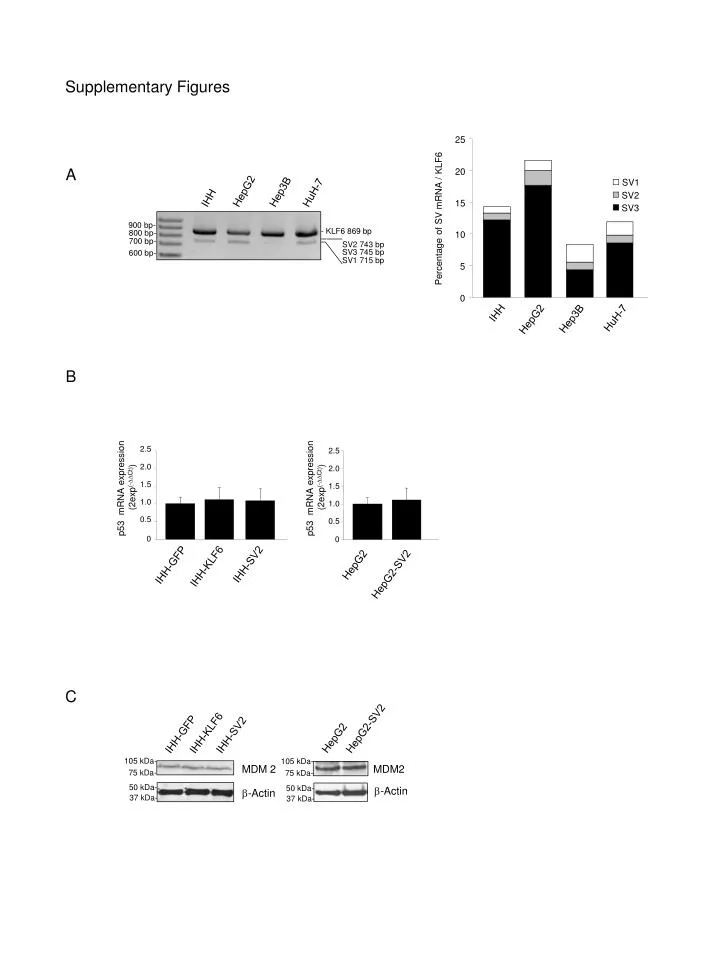
Supplementary figures. A- Qualitative PCR for KLF6 and its splice variants in different hepatic cell lines using primers that permit amplifications of KLF6 and SV variants. PCR products were visualized after agarose gel electrophoresis and ethidium bromide staining. The graph represents the expression of KLF6 splice variants determined by semi-quantitative RT-PCR. Results are expressed as a percentage of KLF6 mRNA expression. The results represent the mean of three different amplifications. B- Expression of p53 mRNA in IHH (left graph) and HepG2 (right graph) stable cell lines by qRT-PCR. Results represent the mean of three amplifications and are calculated using the 2exp(-DDCt) formula. p53 mRNA level in IHH-GFP and HepG2 cells is used as control. C- Expression MDM2 protein in IHH (left panel) and HepG2 (right panel) stable cell lines by Western blot. The gels are representative of three analyses D- Proliferation of Hep3B and Hep3B-SV2 cell lines. After adherence, cells were counted (time 0) and then at every 24h interval until 72h. The graph represents the cell population growth compared to the population at time 0 (expressed as 1). The results represent the mean of three experiments. E- Percentage of cells in the different phases of the cell cycle measured by flow cytometry. Each panel is representative of three analyses. The graph represents the average percentage of cells in the different phases of the cell cycle obtained from three analyses. F- Representation of SV2 expression relatively to KLF6 expression in HCC vs ST in 28 patients. Results are expressed as the ratio SV2/KLF6 expression in HCC vs ST. G- Overall KLF6 mRNA level in normal liver (Normal n=5), surrounding cirrhotic tissues (Cirr n=28) and HCC samples (n=30) measured by qRT-PCR. Results are the mean of three different amplifications and are expressed as 2exp –DCt. N.S. stands for Not Significant. H- KLF6 mRNA expression in 28 patients measured by qRT-PCR. For each patients, KLF6 mRNA level in the tumor is represented as fold change compared to the ST. The values represent the mean (±SEM) of three different quantifications performed in triplicate.For technical reasons, results for samples #17 and #30 could not be obtained. I- Top graph: Representation of SV1 expression relatively to KLF6 expression in HCC vs ST in 28 patients. Results are expressed as the ratio SV1/KLF6 expression in HCC vs ST. Bottom graph: Overall SV1 mRNA level in normal liver (Normal n=5), surrounding cirrhotic tissues (Cirr n=28) and HCC samples (n=30) measured by qRT-PCR. Results are the mean of three different amplifications and are expressed as 2exp –DCt. * p < 0.05. J- Expression of the splice variants SV1 and SV3 in response to SV2 cDNA over-expression by qRT-PCR. SV1 and SV3 expression was measured in IHH-SV2 (left panel) and HepG2-SV2 (right panel) and compared to its level in IHH-GFP, HepG2-GFP and Hep3B cell lines, respectively. Results are the mean of three different amplification and are calculated using the 2exp(-DDct) formula. SV2 mRNA level in IHH-GFP and HepG2-GFP is used as control. N.S. stands for Not Significant. .