Download
1 / 16
160 likes | 163 Views
This program allows users to analyze ramp data and calculate nitrogen rates using the Sensor-Based Nitrogen Rate Calculator (SBNRC) in English or metric units. It includes options for calculating N rates and provides an algorithm for determining N rate with SBNRC. The program also features a calibration ramp analyzer and the ability to save and analyze multiple fields.

E N D
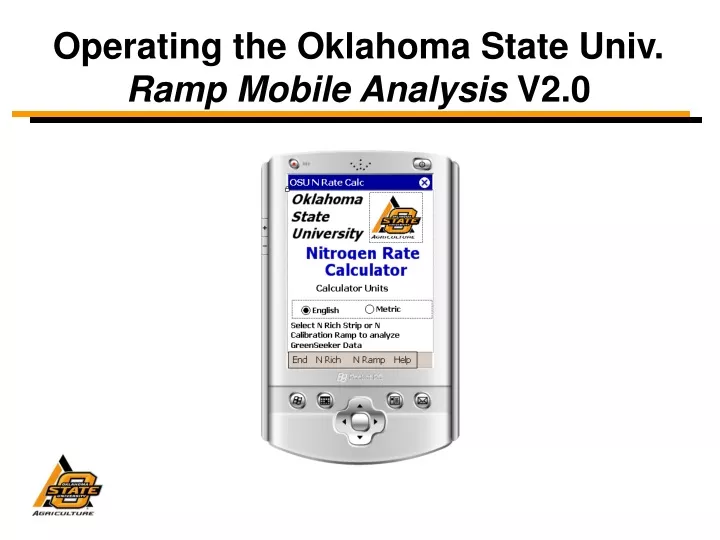
Operating the Oklahoma State Univ. Ramp Mobile Analysis V2.0
Ramp Analysis with the Ramp Analyzer and the Sensor Based NRich Strip Calculator English or Metric Units NRich Strip Analysis with the OSU Sensor Based NRich Strip Calculator (SBNRC) Oklahoma State Univ. Ramp Mobile Analysis V2.0 Main Menu
RAMP analysis only N Rich strip analysis using the Senor Based Nitrogen Rate Calculator (SBNRC) RAMP + Sensor Based Nitrogen Rate Calculator Nitrogen Rate Calculation Options
Algorithm to Calculate N Rate with SBNRC 3 YPN <= YPMAX 2001 1 Predict RI Predict YP0 Predict YPN based on RI Fertilizer N = (GNUP-FNUP)/0.5 2 2 3 4 1 4
NRich NDVI Field Rate NDVI Ramp Max or Upper Limit N Application Rate YPMax YP0 Idealized 16 Step Calibration Ramp
Optimum Fall Applied N Rate Determine Transition Curve Determine Plateau 0.8 0.7 0.6 0.5 NDVI 0.4 0.3 0.2 0.1 0 0 13.3 26.7 34.0 53.3 66.7 80.0 93.3 106.7 120.0 133.3 146.7 160.0 173.3 187.7 200.0 Ramp N Rates, lb/ac Calculating N Rate Using the RAMP Calculating Topdress N Rate
Which Part of the Ramp Do We Measure? Do Not Sense Sense
Preliminaries Analyzed Ramp Output Files *.txtSave in My Device, My Documents, Ramp Analyzed Files Start Icon for Ramp Mobile Analysis program Found under Programs Ramp Configuration Files *.txtFound under My Device, My Documents, Ramp Config Files Keep your HP Ipaq computer battery charged. This program along with the Microsoft program “.Net 2 Compact Framework” are stored in RAM. If the battery runs down, you will need to download “.Net 2 Compact Framework” from Microsoft, copy and install “Ramp Mobile Analysis” from our website and recreate the file structure. “Algorithm Data Jan 08.csv”Found under My Device, My Documents, Ramp Config Files NTech Capture Sensed Ramp Files *.txtStore in My Device, My Documents, Ramp Sensed Files There is a routine in the program to screen false triggers, but it will not screen out false triggers held longer than three seconds.
Instructions are located under the Help, How to Run Pgrm menu commands Return to the main form. Basic Instructions on How to Run the Calibration Ramp Analyzer Program
You will need to load a ramp confguration file before you can analyze the data with either the Ramp calculator or the Ramp & Sensor Based Nitrogen Rate Calculator (SBNRC). There are two OSU ramp configuration files loaded on your computer: a) the “2006 16_Step Ramp.txt” for the 170 ft ramps and b) the “2006 8_Step Ramp.txt” file for the 90 ft long ramps. If you are sensing a ramp not created by the OSU ramp applicators you will need to create and save a ramp configuration file. This routine can be accessed through the RAMP + SBNRC analysis form. Load or Create a Ramp Configuration File
16 4 39.9 After entering the ramp step number and the step N • 1 0 2 13.3 3 26.6 After entering all of the values for the ramp steps, save the ramp configuration file. Saving the file will also load it into the prgram. Listing of ramp numbers and rates entered into the program You can return to the main form at any time Creating Ramp Configuration Files If you are using a ramp not created by the OSU ramp applicators, you will need to use this form to create a ramp configuration file.
Select crop algorithm from pull down menu Expected Nitrogen Use Efficiency at topdress. The default is 50%. The Preplant NUE is typically about 33 % Normally, do not change these values. The farmer or land owner estimate of the maximum likely yield in bu/ac or kg/ha. Number of Growing Degree Days from planting to one day prior to the sensing date. GDD can be obtained from the “NUE.Okstate.edu” web site The SBNRC applied to the NRich Strip also estimates the value of the crop with the N Rate computation as well as the gross return with and without fertilizer. Enter current grain and fertilizer prices Field Settings – Required to Analyze N Rich Strips and Ramp Using the SBNRC You will be prompted to load the algorithm file. Select “AlogrithmData Jan 08.csv”
Ramp Analysis File Menu Prior to analyzing the data you must load an NTech Capture sensed ramp data file. & SBNRC To return to the main menu select Return After you have completed your analysis of each field, save the output file to your computer. You can load and analyze more than one field before exiting the Ramp_Mobile_Analyzer program.
MainForm – OSU Ramp Analysis Output Field Rate NDVI NRich NDVI Yield (bu/ac or kg/ha) with no additional N calculated with SBNRC Response Index =YP0 NDVI/ YPmax NDVI Yield (bu/ac or kg/ha) with topdress N calculated with SBNRC N Rate (lb/ac) calculated with SBNRC N Rate (lb/ac) calculated based on ramp NDVI measurements Analyze Button