Download
1 / 18
180 likes | 284 Views
This document explores the concepts of statistical power and effect size in ecological studies, using duckweed and fox hunting examples to illustrate key points. It discusses the significance of the α-level at 0.05 for hypothesis testing, the risk of Type I and Type II errors, and how sample size impacts the power of a study. Theoretical frameworks are supplemented with practical applications, helping researchers determine the necessary monitoring intensity and duration for wildlife populations effectively.

E N D
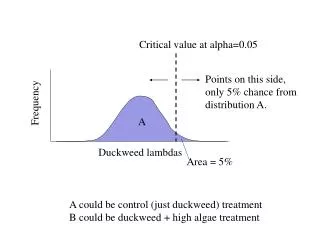
Critical value at alpha=0.05 Points on this side, only 5% chance from distribution A. Frequency A Duckweed lambdas Area = 5% A could be control (just duckweed) treatment B could be duckweed + high algae treatment
Power Analysis Theory (graphical) Conservation examples
If null hypothesis true, A and B are identical Probability that any value of B is significantly different than A = 5% A B Probability that any value of B will be not significantly different from A = 95%
If null hypothesis true, A and B are identical Probability that any value of B is significantly different than A = 5% = likelihood of type 1 error A B Probability that any value of B will be not significantly different from A = 95%
If null hypothesis false, two distributions are different Probability that any value of B is significantly different than A = 1- beta = power A B Probability that any value of B will be not significantly different from A = beta = likelihood of type 2 error
Effect size A B
1. Power increases as effect size increases Power Effect size A B Beta = likelihood of type 2 error
2. Power increases as alpha increases Power A B Beta = likelihood of type 2 error
3. Power increases as sample size increases High n A B
Example 1: Wildlife monitoring programs www.mp2-pwrc.usgs.gov/powcase
To detect a 3% decline with 90% power: • How many sites should you monitor? • How intensively should you monitor sites? • How many years should you monitor sites?
Number of sites needed to detect 3% decline with 90% power Intensity Number of sites needed
Hunt banned (one year only) in 2001 because of foot-and-mouth disease. • Can examine whether the fox population increased in areas where it used to be hunted (in this year). • Baker et al. found no effect (p=0.474, alpha=0.05, n=157), but Aebischer et al. raised questions about power. Baker et al. 2002. Nature 419: 34 Aebischer et al. 2003. Nature 423: 400
157 plots where the fox population monitored. If hunting had no effect, expect 50% of plots to show increases, 50% to show decreases. If hunting had an effect, expect 63% of plots to show increase (as 63% of UK surface area hunted). Effect size if hunting affected fox populations: 13% (63%-50%)
157 plots where the fox population monitored. If hunting had no effect, expect 50% of plots to show increases, 50% to show decreases. If hunting had an effect, expect 63% of plots to show increase (as 63% of UK surface area hunted). Effect size if hunting affected fox populations: 13% (63%-50%) Power = 0.95 !