Download
1 / 12
120 likes | 123 Views
This article explores the use of interactive visualization to enhance the teaching of vector calculus and its connection to other disciplines. The traditional algebraic symbols are complemented and potentially replaced by a visual language that makes concepts more accessible and engaging. The article also highlights the need to bridge the gap between vector calculus and other subjects in the curriculum.

E N D
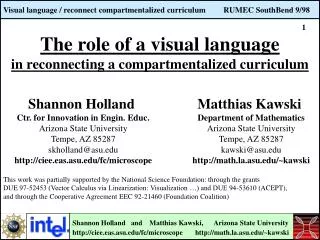
Interactive visualization reconnects a compartmentalized curriculum Matthias Kawski Department of Mathematics Arizona State University Tempe, AZ 85287 kawski@asu.edu http://math.la.asu.edu/~kawski Shannon Holland Ctr. for Innovation in Engin. Educ. Arizona State University Tempe, AZ 85287 skholland@asu.edu http://ciee.eas.asu.edu/fc/microscope
Vector Calculus • The sophomore level classes VC, LA, DE are an exciting places to fully take advantage of computer algebra systems (on higher levels these are more unstable, on earlier levels their prowess leads to endless fights about CAS and the need to learn basic manipulatory skills). 3D-visualization and animations are so compelling that even the most die-hard colleagues find it hard to resist. Here we find the beginnings of an emerging visual language that at the least will complement the traditional algebraic symbols, and likely displace a large amount of these. • Primarily anecdotal evidence suggests that we are doing a particularly lousy job at teaching VC: It is full of un-enlightening formulas, is focused on very narrow applications (E&M, fluids), and is completely disconnected from the rest of the world. It is of little surprise that students not only remember hardly anything of value, but also largely hate the traditional course. • Before students learn about derivatives in single variable they spend more than a year with lines (ratios, slopes, inter/extrapolation). Before we allow anyone into nonlinear functional analysis we require a year of linear functional analysis. But in the standard 3rd semester calculus course we do it all at once: Introduce new (difficult) objects (vector fields), their derivatives (curl, divergence), and the integral theorems -- no surprise that students don’t understand these as more than strange combinations of partial derivatives!Nowhere do we tell them how this kind of derivative, like ALL derivatives is essentially (the characteristic property of) a linear approximation.
Disconnected knowledge • The following is a most telling experience about how bad the compartmen-talization of our curriculum, and both, students’ and faculty’s knowledge is:Both locally and at professional conferences we showed images of vector fields to various people, many of them excellent mathematicians. Asked which of the images represent linear vector fields, most could not tell. This perplexing result was easily explained by the fact that these questions were always asked in a context of vector calculus (which most as students only experience as a course full of formulas). After suggesting:”Just think about DEs”, almost everyone immediately made the right choices (the images of linear fields are very familiar from the qualitative analysis about the equilibrium points of dynamical systems). • If faculty think of DE and VC as disconnected subjects, how shall students make the connection? • Now add the visual images, the visual language: Do the images abovebelong into VC, LA or DE -- can’t tell? Isn’t that what we want! Is the field/DE linear? What does this have to do with the curl and with the period of a (linearized) pendulum being independent of the amplitude?
We asked one simple question: If zooming is so compelling in calc Iwhy not zoom for curl, div in calc III? In the pre-calculator days limits meant factoring and canceling rational expressions; and secant lines disappeared to a point to reemerge as tangent lines……... Today every graphingcalculator has a zoom button.The connection: Derivative <=> local linearity is inescapable Local approximability by linear objects is the one concept that connects ALL notions of derivative -- yet in the past students often had trouble connecting calc 1, curl/div, Frechet derivatives
Interactively visualizing continuity/integrals The naïve way of zooming on a vector field only magnifies the domain, leaving the scale of the range unchanged. This form of “zooming” is the visual approach to “continuity” (=“local constancy”) which is the heart of any notion of solution curves to DEs (Euler, Runge Kutta) and of Riemann integrability (line integrals).
Interactively visualizing curl/divergence In complete analogy to lines/slopes before calculus, and linear functional analysis before nonlinear functional analysis, one ought to develop curl & divergence first in a linear setting -- this is almost linear algebra, and the images are compelling: It is almost as easy to SEE the curl and the divergence of a linear field as the slope of a line -- and as the lens is dragged, the curl and div change (if the field is nonlinear, and they are constant in linear fields). Currently these images are found only in the section on qualitative study of equilibria in DE-texts (source,sink,foci).
Irrotational is a local property A critical test case for student understanding asks whether the pictured field is “irrotational” - most take a global view and say “NO”, clearly exhibiting that they do NOT understand that any kind of derivative only provides info about LOCAL properties. The tactile experience of dragging a lens and changing the zoom-factor dramatically convey “local”, “limit”, and show that the field is irrotational/closed (a key property of the magnetic field about an infinitely long straight wire carrying a constant current, or of the complex field 1/z, the origin of algebraic topology).
Interactively visualizing various flows Individual integral curves are studied in DE (lots of software available).The important application is to consider how small regions evolve under the full nonlinear flow, under the linearized flow, or only components of the linearized flow: trace (divergence!), symmetric part (chaos!), and skew symmetric part (curl). Our utility will provide all these integratedanalogues of the lenses for zooming (differentiation).
Technical background 1 • The JAVAscope uses a powerful, fast parser written by David Wanqian Liu. It includes hyperbolic functions, and floor/ceil which allow the “piecewise defined” formulas. Selected fields (magnetic/gravitational,…) are preprogrammed on a pull-down menu for faster access. Standard window controls like grid size, window size etc are available. The scales for arrows are explicitly displayed. • Various lenses display “magnified” vector fields and may be dragged across the screen. The magnification factors may be changed interactively (and soon also: independently). • There are FOUR different scales that ones needs to understand:(assuming equal scaling along x and y-directions):SCALE 1: domain of x and ySCALE 2: range of the vector field (magnitude of arrows)SCALE 3: magnified domain inside the lens Dx and Dy SCALE 4: magnified range inside the lens (arrows/arrow-heads) • SCALE 1 (window size, grid size) is user determined.SCALE 2 is calculated so that arrows don’t overlapSCALE 3 = e * SCALE 1 magnification chosen by user SCALE 4 = SCALE 2 when zooming for continuity/integrabilitySCALE 4 = e *SCALE 5 when zooming for derivatives • The basic SCALE 5 for the “arrow-heads” in the lenses for differentiation uses a numeric estimate of the C1-norm of the field (sampling the numeric Jacobian at about 100 points inside the large window). Specifically, no matter where the lens is moves, the arrows inside the lens shall not overlap. Further magnification of domain and range is normally in lock-step.
Technical background 2 • The various scales are visible in the window (we may change the format according to feedback we get). These scales NEED to be addressed in class -- too many students do not understand that almost always the scales for the domain (tickmarks on the axes) and for the range (arrow length) are not the same but are simply chosen so as to maximize arrow length while avoiding overlaps. Specifically, the images of F(x,y) and cF(x,y) look the same for any positive constant c - distinguishing underlying space and tangent space is critical to make sense out of applications, to provide basis for later work. • The nonlinear field is decomposed using the “projection”This is a reasonably geometric construction that is feasible in real time in JAVA. It assures that the components of the nonlinear field converge to the (skew) symmetric parts of the Jacobian linearization. (Note: The “transpose”makes no sense for general nonlinear fields….) • The flow-module uses an adaptive scheme that adjusts the number of points along the boundaries of the region that are integrated using standard Runge-Kutta algorithms, nothing fancy (some details are still under development).Key features are that flows of linear fields preserve linear features, nonlinear flows distort linear edges immediately, curl generates therotation, divergence is rate of expansion, symm part shows principal axes
Morale, lessons learnt • Technology, primarily CAS and JAVA, open exciting new doors -- but lots of creativity is asked for. We need to re-evaluate our approaches to subjects at all levels, as the many basic assumptions may no longer be true. • Visual tools provide a powerful alternative to the traditional, almost exclusively algebraic formalism. Not only can analytic concepts (existence of a limit….) be rigorously formulated using the visual language, this language also provides considerably more compelling connections between traditionally separately presented topics. Here, no x’es can provide the obvious connection between VC and DE as compellingly as the illustrations of the vector fields, their derivatives, and their flows….. • This visual language suggests a new look the vertical prerequisite structure of mathematics, at access for everyone, at reaching and committing traditionally underrepresented groups.. • Even for utilizing new technology at the introductory level there is a requi-rement for deep mathematical understanding. In our case typical questions that arise are: How to split a nonlinear vector field in a geometrically sound fashion (that is computationally feasible) into components that converge to the symmetric and skew symmetric parts of the Jacobian? How to handle DE applications where the states have non-commensurable dimensions (no notion of angle, curl?, yet integrability & exterior derivatives make sense)? • It makes little sense to use calculators only to do yesterday’s exercises faster -- most of these never had any intrinsic value: They were appropriate for the then-technology to deepen the understanding. With new technology we need new exercises to effectively learn a re-evaluated curriculum.
To find out more • The JAVAscope is freely available on the WWW • The “differential version” (zoom lenses) works fine, except for a few minor bugs, and the separate zoom controls…….. • The integrated version (flows) will be completed this summer. • An accompanying technical preprint is available on-line. - technical information about the program - rationale and geometric background - suggestions for exploratory exercises • A “Book of Zooming”: Limits = zooming : From sequences to Stokes theorem is under preparation. Almost a coffee-table picture book with background math, about 50 kinds of zooming and related topics, accompanied by an interactive MAPLE-CD • Calculus of Vector FieldsUnder a new 1998-99 NSF grant we are working on a radically new approach to vector calculus, which develops all key concepts in a linear setting first (all the way to Stokes’ theorem), which uses state-of-the-art visualization throughout, and which firmly integrates traditionally separate points of view: VC, LA and DE.By affirmatively integrating DE and VC, this approach provides much richer applications - largely inspired by geometric control -- of the integral theorems than the usual narrow focus on E&M and fluid dynamics.A short paper-text, MAPLE-worksheets & JAVA-applets on CD, and extended projects shall appear throughout the next 2 years.