Download
1 / 34
450 likes | 844 Views
Strength and Ductility. Determining Tensile Strength from the stress-strain curve is easy. Just locate the highest point on the curve. TS = 82 ksi. Yield strength s y is defined as the stress needed to permanently stretch a tensile specimen so that the permanent strains is 0.002 (0.2%).

E N D
Determining Tensile Strength from the stress-strain curve is easy. Just locate the highest point on the curve. TS = 82 ksi
Yield strength sy is defined as the stress needed to permanently stretch a tensile specimen so that the permanent strains is 0.002 (0.2%)
Start by drawing a line from .002 parallel to the elastic portion of the stress-strain curve
When a part is stressed plastically, part of the strain is elastic and temporary, part is plastic and permanent. Total strain under load is about .0046 Permanent strain is .002
Example: Determine the true stress and strain just before necking occurs Answer: s = 82 ksi just before necking occurs At this point e = 0.014 sT = s(1+e) = 82ksi (1.014) = 83 ksi eT = ln(1+e) = ln(1.014) = .0139
An edge dislocation appears as an extra half-plane of atoms inserted into the crystal
Edge dislocations appears as black lines in a high magnification micrograph Dislocation 51,540X
Shear force Shear force A screw dislocation is like a tear in the material It is called a screw dislocation because the dislocation causes planes in the lattice to take a helical shape much like the screw thread Maximum strain energy is concentrated along this line
Movement of Dislocations Both edge and screw dislocations can move when a shear stress is applied. The “extra plane” of atoms moves gradually through the crystal, much as a caterpillar moves.
The Burgers vector b is a vector with the length and direction that the dislocation line will move during slip edge dislocation screw dislocation
Slip system Dislocation line • The Burger’s vector and the dislocation line together form a slip plane • The Burger’s vector defines the slip direction Burger’s vector Slip plane The slip direction and the slip plane together form a slip system
Slip occurs preferentially in close-packed directions on close-packed planes Example: FCC has 4 close packed planes. There are 3 close-packed directions in each plane. 4 planes x 3 directions/plane = 12 possible slip systems in FCC
Slip occurs preferentially in close-packed directions on close-packed planes BCC has 6 “kind of” close packed planes (the {110} family). There are 2 close-packed directions in each plane. 6 planes x 2 directions/plane = 12 possible slip systems in BCC Because the planes are not close-packed, slip is not as easy in BCC as in FCC.
Slip occurs preferentially in close-packed directions on close-packed planes Example: HCP has only 1 set of close-packed planes. There are 3 close-packed directions in this plane. 1 plane x 3 directions/plane = 3 possible slip systems in HCP. Consequently slip is not easy in HCP materials.
Specimens in tension deform most readily when the slip system is at a 45°angle to the direction of pull Example: Hexagonal Close-packed crystals have one close-packed plane (0001 plane)
Grains boundaries are zones of atomic disorder between regions of well-ordered atoms Well-ordered atoms Zone of disorder Grain boundary Grain
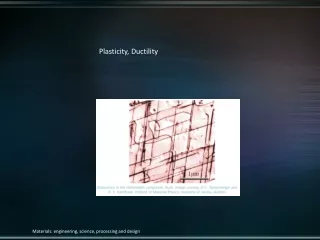
Slip lines are oriented differently within each grain of this plastically deformed copper sample Even within crystals, different slip systems can be seen
Plastic deformation alters the grain structure of polycrystalline materials Before deformation After deformation
The term microstructure refers to the shape and size of grains Microstructure is best observed using a photomicrograph • Polish the surface of the metal • Attack it with an acid to preferentially remove material between grains • Observe under a microscope, and photograph it.
Linear Grain Size Determination Each line is 50 mm long in a 90X micrograph A • Count # of boundaries each line crosses • Divide by 50 to get grains/mm in the photo • Multiply by 90 to get true # of grains/mm B C 90X
Area-based Grain Size Determination The American Society of Testing and Materials (ASTM) provides a standard set of hexagonal grids to be used with 100X photomicrographs Grain size 4 Grain size 6 Grain size 5 Grain size 3 Grains per square inch is given by: N = 2n-1 Where: N = number of grains per square inch at 100X n = grain size
Example: Are the grains in the photo grain size 6? Grain size 6 Try to match the hexagon size to the grain size in the micrograph 100X N = 2n-1 Where: N = number of grains per square inch at 100X n = grain size
Are the grains in the photo grain size 5? Grain size 5 100X N = 2n-1 Where: N = number of grains per square inch at 100X n = grain size
Are the grains in the photo grain size 4? Grain size 4 100X N = 2n-1 Where: N = number of grains per square inch at 100X n = grain size
Are the grains in the photo grain size 3? Grain size 3 100X N = 2n-1 Where: N = number of grains per square inch at 100X n = grain size
Are the grains in the photo grain size 2? Grain size 2 100X N = 2n-1 Where: N = number of grains per square inch at 100X n = grain size
A Frank-Read source can generate dislocations • A dislocation is pinned at two ends by lattice defects. • As the dislocation continues to move, it bends. • Dislocation loops back on itself. • A new dislocation is created.
Coldworking increases dislocation density to the point that they start to interfere with each other
Yield Strength, Tensile Strength, and Ductility as Functions of % Cold Work Yield Strength Tensile Strength Ductility ksi MPa MPa ksi %EL % Cold Work
Recrystallization of cold-worked brass • 33% cold-worked brass before • annealing b) 3 s at 580°C – onset of recrystallization d) 8 s at 580°C – recrystallization is complete c) 4 s at 580°C
Recovery Grain growth Effect of annealing on a cold-worked brass Recrystallization Grain size TS ductility Annealing Temperature (deg C)