Download
1 / 27
270 likes | 632 Views
Statistics at the EPA. Barry D. Nussbaum, Chief Statistician Nussbaum.barry@epa.gov Presented to COPAFS September 21, 2012. Where Do We Get Our Data. Monitoring Administrative Data Permits Required Submissions We may be the league leader in this. Uses of Data .

E N D
Statistics at the EPA Barry D. Nussbaum, Chief Statistician Nussbaum.barry@epa.gov Presented to COPAFS September 21, 2012 U.S. Environmental Protection Agency
Where Do We Get Our Data • Monitoring • Administrative Data • Permits • Required Submissions • We may be the league leader in this U.S. Environmental Protection Agency
Uses of Data • Like most agencies we never know who will use what for whatever • I never met a datum I didn’t like BUT • Data are neither good nor bad, but may be good or bad for a particular use U.S. Environmental Protection Agency
Toxics Release Inventory • A great example • Annual reporting of toxics released, recycled, • 20,000 reporting entities • 650 toxic chemicals • Size requirement • No mobile sources • Engineering estimates U.S. Environmental Protection Agency
Other Uses of TRI Data • Financial Sector Used by some mutual funds for “social responsibility” • Labor Unions Used in contract negotiations • Internal Revenue Used for tax on CFCs • Internal Processing Reactions to filing led to lower releases U.S. Environmental Protection Agency
Has anyone written about it • Several books • Many Research Articles (EPA funded 40) • Impact of information disclosure • Factors driving firms to adopt environmental policies • Effects of pollution prevention efforts • Relationship between parents and subsidiaries U.S. Environmental Protection Agency
Some New Items • Proving tests equivalent • Data we can’t detect • Bayes • Social Media • Geoplatform U.S. Environmental Protection Agency
Equivalence of Tests • Many of our regulations incorporate testing methodology • What happens when someone has a better, cheaper, quicker test? • Showing equivalence is the opposite of what we learn all through statistical studies U.S. Environmental Protection Agency
Methods to Show Equivalence • Two One-Sided t-test • Tricky when a new method has some physical restrictions • Equality of • Means • Variances • Covariances U.S. Environmental Protection Agency
Non-Detects • A problem, paradoxically • Occurs in many of our programs • Several Techniques • Half the Detection Limit • All the Detection Limit • Kaplan-Meier Techniques • ProUCL U.S. Environmental Protection Agency
Our Foray Into Social Media • Statipedia • A wiki • Confident Correlation • A version of facebook • From Yammer to Office 365 Suite • Collaborative tool U.S. Environmental Protection Agency
GeoPlatform • We map everything • An opportunity to collapse our stovepipes • Water quality • Air quality • Hazardous waste • Geographic entities U.S. Environmental Protection Agency
A New “Most Popular Question” U.S. Environmental Protection Agency
Statistical Software • SAS • S-Plus • BMDP • MATLAB • STATISTICA • Mathematica • Systat • Minitab U.S. Environmental Protection Agency
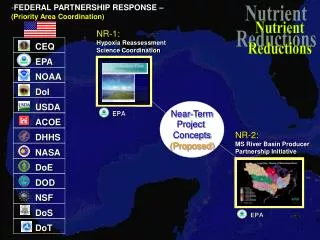
EPA’s Main Roles • Collect samples along the shoreline and beyond for chemicals related to oil and dispersants in the air, water, and sediment • Support and advise the Coast Guard efforts to clean the reclaimed oil and waste from the shoreline • Closely monitor the effects of dispersants in the subsurface environment
EPA Data Collection • Air Quality • Air monitoring aircraft • Air monitoring on the ground • Water Samples • Sediment Sampling
Monitor for air pollutants, such H2S, along the coast Siting decisions, using statistics 6 sites collecting H2S concentrations near Venice, LA Reduction in H2S site operation Limitations in time, $, and equipment REALITY
July 4th weekend: Can you work with our data manager to retrieve all the historical H2S data from the Venice locations? What we need is a pretty basic analysis of where the values are highest. We are deploying a mobile trailer from region 5 to Venice and the V02 site has the best infrastructure. However, if its H2S distribution is lower than V03, V05, or V06, then we have a problem. Could this be handled by Tuesday? Region 5 is hitting the road and we need to determine the destination! Fireworks or stats? Hmm…
We cannot count on V02 to represent the other sites for H2S Highest peaks V04 V05 V06 “Overall high” site: consistently higher than other sites V03 Answer isn’t always clear cut. Do we want to protect the public from the occasional high “peaks,” or do we want to keep track of consistently high H2S concentrations ? V01 V02 Best infrastructure
Presenting the Data • In general, get it out fast • Some description