Download
1 / 1
10 likes | 112 Views
A COMPARISON OF UPPER LEVEL JETS DURING TWO SEVERE WEATHER EVENTS ACROSS THE MIDSOUTH Michael Scotten and Kristin Scotten NOAA/NWS WFO MEMPHIS. 2 APRIL 2006. 1 MARCH 2007. Figure 1: Water vapor satellite image with RUC Model 300 mb winds and streamlines at 23 UTC. Figure 5 :

E N D
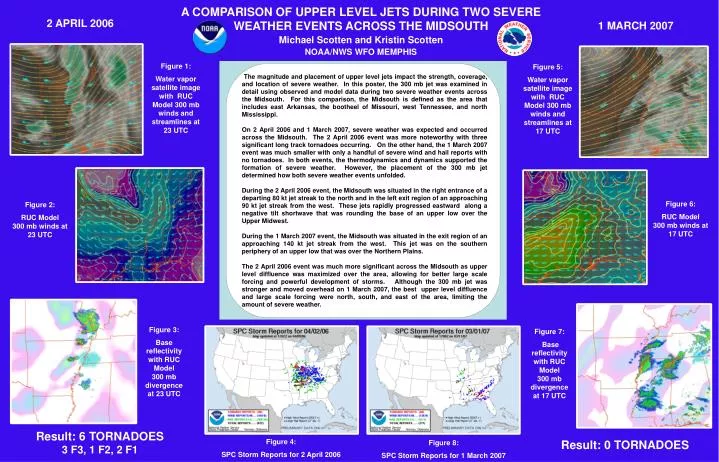
A COMPARISON OF UPPER LEVEL JETS DURING TWO SEVERE WEATHER EVENTS ACROSS THE MIDSOUTH Michael Scotten and Kristin Scotten NOAA/NWS WFO MEMPHIS 2 APRIL 2006 1 MARCH 2007 Figure 1: Water vapor satellite image with RUC Model 300 mb winds and streamlines at 23 UTC Figure 5: Water vapor satellite image with RUC Model 300 mb winds and streamlines at 17 UTC The magnitude and placement of upper level jets impact the strength, coverage, and location of severe weather. In this poster, the 300 mbjet was examined in detail using observed and model data during two severe weather events across the Midsouth. For this comparison, the Midsouthis defined as the area that includes east Arkansas, the bootheelof Missouri, west Tennessee, and north Mississippi. On 2 April 2006 and 1 March 2007, severe weather was expected and occurred across the Midsouth. The 2 April 2006 event was more noteworthy with three significant long track tornadoes occurring. On the other hand, the 1 March 2007 event was much smaller with only a handful of severe wind and hail reports with no tornadoes. In both events, the thermodynamics and dynamics supported the formation of severe weather. However, the placement of the 300 mb jet determined how both severe weather events unfolded. During the 2 April 2006 event, the Midsouth was situated in the right entrance of a departing 80 kt jet streak to the north and in the left exit region of an approaching 90 kt jet streak from the west. These jets rapidly progressed eastward along a negative tilt shortwave that was rounding the base of an upper low over the Upper Midwest. During the 1 March 2007 event, the Midsouth was situated in the exit region of an approaching 140 kt jet streak from the west. This jet was on the southern periphery of an upper low that was over the Northern Plains. The 2 April 2006 event was much more significant across the Midsouth as upper level diffluence was maximized over the area, allowing for better large scale forcing and powerful development of storms. Although the 300 mb jet was stronger and moved overhead on 1 March 2007, the best upper level diffluenceand large scale forcing were north, south, and east of the area, limiting the amount of severe weather. Figure 6: RUC Model 300 mb winds at 17 UTC Figure 2: RUC Model 300 mb winds at 23 UTC Figure 3: Base reflectivity with RUC Model 300 mb divergence at 23 UTC Figure 7: Base reflectivity with RUC Model 300 mb divergence at 17 UTC Result: 6 TORNADOES 3 F3, 1 F2, 2 F1 Figure 4: SPC Storm Reports for 2 April 2006 Result: 0 TORNADOES Figure 8: SPC Storm Reports for 1 March 2007