Download
1 / 22
220 likes | 461 Views
Determinants of Sam Adams Beer. Leah Semonelli Iryna Sieczkiewicz Meghan Smith Adamson E. Streit. Agenda. Objective Hypotheses Variable Identification Methodology Statistics Results Conclusion. Objective.

E N D
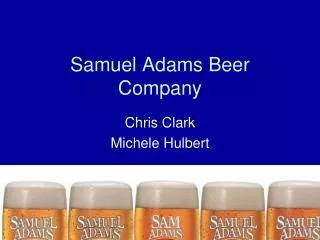
Determinants of Sam Adams Beer Leah Semonelli Iryna Sieczkiewicz Meghan Smith Adamson E. Streit MBA 555 – Professor Gordon H. Dash, Jr.
Agenda • Objective • Hypotheses • Variable Identification • Methodology • Statistics • Results • Conclusion MBA 555 – Professor Gordon H. Dash, Jr.
Objective • Develop an econometric model that explains the determinants of sales in Sam Adams beer • Use a variety of pertinent data to help explain this relationship MBA 555 – Professor Gordon H. Dash, Jr.
Hypotheses • H1: Weather conditions influence Sam Adams sales • H2: Advertising affects Sam Adams sales • H3: Major sporting events lead to quarterly increases in Sam Adams sales • H4: Major holidays lead to quarterly increases in Sam Adams sales MBA 555 – Professor Gordon H. Dash, Jr.
Variables – Dependent • Quarterly beer sales of the Boston Beer Company, Inc. from 1997 to 2006 MBA 555 – Professor Gordon H. Dash, Jr.
Variables – Independent • Nat’l Quarterly Precipitation Data • Nat’l Quarterly Temperature Data • No. Major U.S. Holidays per Qtr. • Major Sporting Events per Qtr. • Sam Adams Advertising Allowance MBA 555 – Professor Gordon H. Dash, Jr.
Variable ID & Definitions • Exogenous • Major Sporting Events • U.S. Holidays • Temperature • Precipitation • Endogenous • Advertising MBA 555 – Professor Gordon H. Dash, Jr.
Methodology • Data was collected from the U.S. gov’t websites on Internet • E.g., SEC, NOAA • Monthly data was converted into quarterly data using Microsoft Excel MBA 555 – Professor Gordon H. Dash, Jr.
Methodology, Cont’d • WinORS™ software package was used to perform all calculations • Stepwise Regression was used to determine the most significant variables • Ordinary Least Squares (OLS) tested data for: • Normality • Homoscedasticity • Multi-Colinearity • Serial Correlation MBA 555 – Professor Gordon H. Dash, Jr.
Statistics • Variables not statistically significant: • No. Major U.S. Holidays • (E.g., Memorial Day, Labor Day) • No. Major Sporting Events • (E.g., World Series, Superbowl) MBA 555 – Professor Gordon H. Dash, Jr.
Statistics, Cont’d • Variables are statistically significant: • Precipitation levels • Avg. Temperature • Advertising Expense MBA 555 – Professor Gordon H. Dash, Jr.
Results • The Derived Equation: Q = 122.746 + 0.0005A + 1.909T – 1.490P • Q = No. Barrels sold (Thousands) • A = Advertising ($ Thousands) • T = Avg. Temperature (oF) • P = Avg. Precipitation (In.) MBA 555 – Professor Gordon H. Dash, Jr.
Result’s Cont’d • Regression Predictive Model Plot MBA 555 – Professor Gordon H. Dash, Jr.
Result’s Cont’d • Model Data P value = 0.00002; CI =99.998% MBA 555 – Professor Gordon H. Dash, Jr.
Result’s Cont’d • Multicolinearity • Variance Inflation Factors (VIFs) • Measure the impact of colinearity in a regression model on the precision of estimation. It expresses the degree to which colinearity among the predictors degrades the precision of an estimate. • In practice, VIF < 10.0 • Our VIF = 2.128 MBA 555 – Professor Gordon H. Dash, Jr.
Result’s Cont’d • VIF Parameters NOTE: WinORS calculates our VIF at 2.128, which is the same as above MBA 555 – Professor Gordon H. Dash, Jr.
Result’s Cont’d • Residual Error (Constant Var.) Note: Ho for White’s Test states that residuals are Homoscedastic MBA 555 – Professor Gordon H. Dash, Jr.
Result’s Cont’d • Constant Variance Plot MBA 555 – Professor Gordon H. Dash, Jr.
Result’s Cont’d • Outliers & Normality Plot MBA 555 – Professor Gordon H. Dash, Jr.
Result’s Cont’d • Elasticities All variables are inelastic!! MBA 555 – Professor Gordon H. Dash, Jr.
Conclusions • Major Holidays & Major Sporting Events do not affect sales of Sam Adams • Advertising, Temperature, & Precipitation affect Sam Adams sales • More in-depth data needed to prove or disprove R2 ~ 75% at CI = 99% MBA 555 – Professor Gordon H. Dash, Jr.
Result’s Cont’d References Securities & Exchange Commission http://www.sec.gov National Oceanic and Atmospheric Administration http://www.ncdc.noaa.gov/oa/climate/research/cag3/cag3.html Class Notes, Professor Gordon H. Dash, Jr. MBA 555 – Professor Gordon H. Dash, Jr.