Download
1 / 20
200 likes | 305 Views
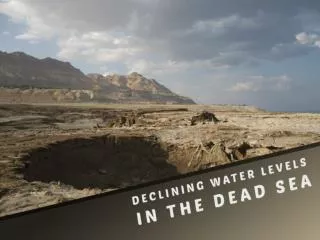
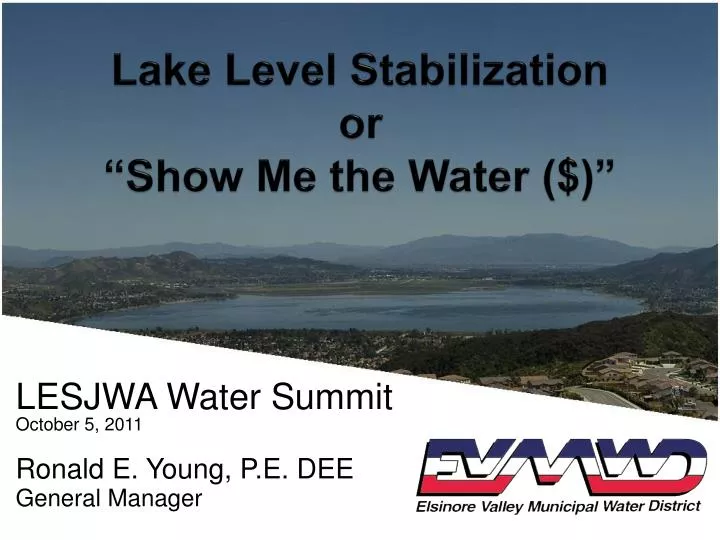
Lake Level Stabilization or “Show Me the Water ($)”. LESJWA Water Summit October 5, 2011 Ronald E. Young, P.E. DEE General Manager. Lake Elsinore. Bust!. 1964. Boom!. 2008. Water Sources for Stable Lake. Rain Local Groundwater Recycled Water Imported Water. Rain and Runoff. (+)

E N D
Lake Level Stabilizationor“Show Me the Water ($)” LESJWA Water SummitOctober 5, 2011 Ronald E. Young, P.E. DEE General Manager
Lake Elsinore Bust! 1964 Boom! 2008
Water Sources for Stable Lake • Rain • Local Groundwater • Recycled Water • Imported Water
Rain and Runoff • (+) • Low Cost • Pretty Clean • (-) • Unpredictable • Floods: 1841, 1862, 1864, 1884, 1916, 1937-38, 1941, 1969, 1978-80, 1983, 1993 • Dry: 1810, 1859, 1951, 1958, 1964 • Contain Nutrients from Urban Areas and Agriculture
Local Groundwater • (+) • Island Wells Built by State 1966-68 • Wells Not Potable Quality (Sulfur & Temperature) • (-) • Power Cost and Maintenance - $225/AF • Indirect Impact on Basin Groundwater Levels
Recycled Water • (+) • Readily Available from Local Area • High Quality, Meets State Biological Standards • Accepted by Public • (-) • Contains Nutrients • Cost of Treatment - $217 /AF • Strict Nitrogen and Phosphorus Limits
Imported Water • (+) • Provided by MWDSC – Colorado River or State Water Project • Delivered Through Canyon Lake • 1964 – 1966 Purchased 44,250 AF (or 15 feet water) • (-) • Not Always Available • Expensive $494 /AF
Water Quantities • Rain - Average: 10,000 AF/year • Local Groundwater - Average: 1,000 AF/year • Recycled Water - 5,500 AF/year • Imported Water - ? • Evaporation - 15,000 AF/year
Water Quality • TDS (salts)-Requirement-2,000 mg/l Lake Objective Actual RW about 700 mg/l • Total Nitrogen Requirement-1.0 mg/l & <16,372 #/yr Actual 3 mg/l – excess offset by aeration • Total Phosphorus Requirement-0.5 mg/l & <8,186 #/yr Actual 0.3 mg/l & 5,300 #/yr
Water for the Lake 1997 - Recycled Water Task Force - White Paper – 18 Citizens Agree2001 - Lawsuit for Water To Lake - Settled Lawsuit with R-W & Island Well WaterTo DateIsland Wells 9,136 AFRecycled Water 26,915 AF Total 35,750 AF
Water for the Lake 2002 - $1.4M Island Wells Improved2003 - 1.4M Axial Flow Pumps2004 - .5M Island Wells Piped to Wetlands2007 - 2.2M Aeration System 2008 - 1.8M Permanent Pipe2009 - .8M Phosphorus Removal
More Water Means Better Quality • Dilutes Salts and Nutrients • Improves Environment for Biomanipulation • Reduces Chlorophyll-a (Algae)