Download
1 / 22
320 likes | 571 Views
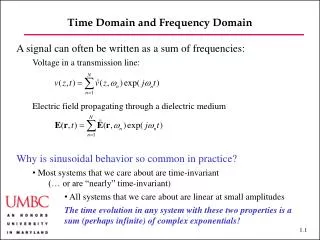
Frequency Domain Characterization of Signals . Prof. Hongang Wang. Signal Representation. Signal? Time-domain description Waveform Periodic vs. non-periodic signals Frequency-domain description Periodic signals Sinusoidal signals Fourier series for periodic signals. Signal?.

E N D
Frequency DomainCharacterization ofSignals Prof. Hongang Wang
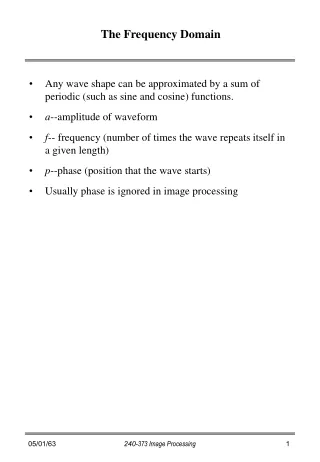
Signal Representation • Signal? • Time-domain description • Waveform • Periodic vs. non-periodic signals • Frequency-domain description • Periodic signals • Sinusoidal signals • Fourier series for periodic signals
Signal? • A variable (or multiple variables) that changes in time • Speech or audio signal: A sound amplitude that varies in time • Temperature readings at different hours of a day • Stock price changes over days • More generally, a signal may vary in 2-D space and/or time • A picture: the color varies in a 2-D space • A video sequence: the color varies in 2-D space and in time • Continuous vs. Discrete • The value can vary continuously or take from a discrete set • The time and space can also be continuous or discrete
Waveform Representation • Waveform representation • Plot of the variable value (sound amplitude, temperature reading, stock price) vs. time • Mathematical representation: s(t)
Sample Speech Waveform »[y,fs]=wavread(‘hello.wav'); »figure;plot(y); »x=y(10:45000);plot(x); Blown-upofasection. »figure;plot(x); »axis([2000,8000,-0.1,0.08]); Download: http://www.faculty.umassd.edu/honggang.wang/ece591_web/lecture.html
Ring Waveform Sample • [y,fs]=wavread(’ringin.wav'); • figure; plot(y);
Sinusoidal Signals • s(t ) =A cos(2πf0t + f ) • f0 : frequency(cycles/second) • T0= 1/f0: period • A : Amplitude • f : Phase (time shift) Sinusoidal signalsare important because theycanbeused tosynthesize any signal – An arbitrary signal can be expressed as a sum of manysinusoidal signalswith different frequencies, amplitudes and phases
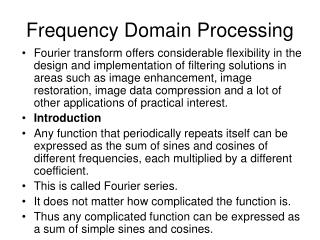
Frequency of An ArbitrarySignal? • Sinusoidal signals have a distinct (unique) frequency • An arbitrary signal does not have a unique frequency, but can be decomposed into many sinusoidal signals with different frequencies, each with different magnitude and phase • Fourier series and Fourier transform are ways to find spectrums for periodic and aperiodic signals, respectively
Approximation of Periodic Signalsby Sum of Sinusoids Example: http://en.wikipedia.org/wiki/Square_wave
Period Signal • Period T: The minimum interval on which a signal repeats • Fundamental frequency: f0=1/T • Harmonic frequencies: kf0
Approximation of Periodic Signals bySinusoids • Any periodic signal can be approximated by a sum of many sinusoids at harmonic frequencies of the signal (kf0 ) with appropriate amplitude and phase. • The more harmonic components are added, the more accurate the approximation becomes. • Instead of using sinusoidal signals, mathematically, we can use the complex exponential functions with both positive and negative harmonic frequencies
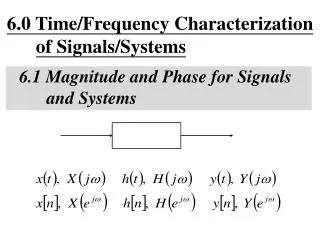
Complex Exponential Signals • Complex number • Complex exponential signal • Euler formula
Fourier Series Representation of Square Wave • Apply the Fourier series analysis formula to the square wave, we get
Fourier Transform for Non-Periodic Signals • A periodic signal=uncountable number of harmonics->integral instead of sum
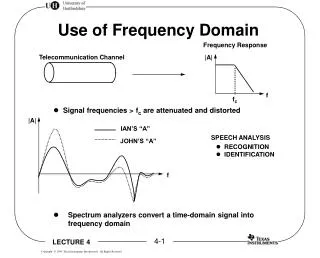
Advantage of Frequency DomainRepresentation • Clearly shows the frequency composition of the signal • One can change the magnitude of any frequency component arbitrarily by a filtering operation • Lowpass-> smoothing, noise removal • Highpass-> edge/transition detection • High emphasis -> edge enhancement • One can also shift the central frequency by modulation • A core technique for communication, which uses modulation to multiplex many signals into a single composite signal, to be carried over the same physical medium.
Typical Filter • Lowpass-> smoothing, noise removal • Highpass-> edge/transition detection • Bandpass-> Retain only a certain frequency range
Low Pass Filtering • Remove high freq, make signal smoother
High Pass Filtering • Remove low freq, detect edges
A Image Representation • From Time to Frequency Domain (DWT) • DWT functions in Matlab • x=imread(‘barbara.jpg’) • ???? • Imshow(x);
Hands-On Problem (Homework) Step 1: Record your voice and save it as .wav file or download a .wav file from internet Step 2: Display the waveform Step 3: Read a .jpg image file Step 4: Display the image after DWT transformation Step 3: Submit your work including code and results (email or paper) at 5:00 pm next Thursday.