Download
1 / 64
640 likes | 811 Views
Todd D. Taylor, Ph.D. Genome Annotation and Comparative Analysis Team Computational and Experimental Systems Biology Group RIKEN Genomic Sciences Center taylor@gsc.riken.jp Bioinformatics and Comparative Genome Analysis Course Institut Pasteur Tunis - Tunisia April 2, 2007.

E N D
Todd D. Taylor, Ph.D. Genome Annotation and Comparative Analysis Team Computational and Experimental Systems Biology Group RIKEN Genomic Sciences Center taylor@gsc.riken.jp Bioinformatics and Comparative Genome Analysis Course Institut Pasteur Tunis - Tunisia April 2, 2007 Understanding human genome (Structural) evolution through chimpanzee and mouse comparisons
Key projects • Human • Chromosome 21 (Nature, May 2000) • 17 of 33.5 Mb • Chromosome 18p (Nature, September 2005) • 16 Mb • Chromosome 11q (Nature, March 2006) • 81 Mb • ~4-5 % contribution to the Human Genome Project • Chimpanzee • Chromosome 22q (Nature, May 2004) • 33.5 Mb (syntenic to human chr21) • Chromosome Y (Nature Genetics, January 2006) • Development of novel methods for gene and promoter prediction • Identifying genes missed by other high-throughput methods • Identification of unique regulatory mechanisms
Comparative approaches for identification of functional elements • Looking for similarities • Compare with distant species, like mouse • Regions that are conserved may be important • Looking for differences • Compare with close species, like primates • Regions that are different may be important • Of course, there are exceptions to every rule!
Phylogeny of human and it’s close relatives 5 MYa Homo ~250MYa ~350MYa Hominidae Hominoidea Pan Hominidae Catarrhini Gorilla Anthropoidea Hominoidea Eutheria (placentalia) Primates Pongo Amniota (amniotes) Mammalia Primates Gibbons Old world monkeys Mammalia New world monkeys Prosimians Lagomorpha Heterodonty Mammary glands Homoeothermic Hair Placentation (in most), amnion, internal fertilization Sweat and sebaceous glands Anucleate red blood cells Rodents Metatheria Prototheria Sauropsida Reptilia + Aves
Mouse genome mapped on the human genome • 34% maps to identical sequence in human genome Hiram Clawson and Kate Rosenbloom (UCSC). 09 June 2006
Chimpanzee genome mapped on the human genome • 95% maps to identical sequence in human genome Hiram Clawson and Kate Rosenbloom (UCSC). 09 June 2006
Potential enhancer elements that are evolutionary conserved Nobrega, et al. Science 302, 413 (2003)
Important differences with humans • Size • Intelligence • Language • Ageing • Disease susceptibility • Cancer • Schizophrenia • Autism • Triplet expansion diseases • AIDS • Hepatitis
What makes us human?Is humanity written in our genome? Newton,2002年4月号
1.23% substitution BES identity distribution
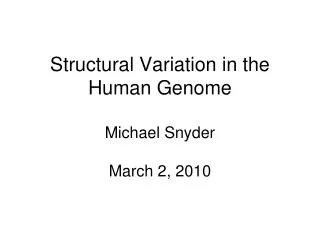
Crude differences between human and chimpanzee genomes • Number of simple repetitive sequences • Insertion of Alu and L1 elements • Unique sequences • Local duplications • Translocations • Inversions • Fewer CpG Islands predicted in chimp
Whole chromosome sequencing strategy • Compare with small ‘representative’ human chromosome (21) • Clone-based sequencing strategy • Map chimp BAC-end sequences to human chr. 21 • Screen libraries for additional clones to fill gap regions 3 gaps, over 99% coverage
Human Chr21 q-arm Chimp Chr22 q-arm 100% Identity 85% 5Mb Whole chromosome comparison
Larger structural rearrange-ments Human Chr21 q-arm 100% Chimp Chr22 q-arm Identity 85% 1Mb
Distribution of divergence of the autosomes(whole chimp genome) Chimpanzee Sequencing & Analysis Consortium. Nature (205) 437:69-87
Base substitution rate • Overall : 1.44% SINE/Alu 1.81% LINE/L1 1.38% CpG islands 2.26% Simple repeats 4.06%
Emergence of human-specific characteristics Human-specific characteristics have been acquired during the 5 million years since the divergence between Pan and Homo. Orangutan Gorilla Time Pongo (Orangutan) Gorilla Pan (Chimpanzee) Homo (Human) 5〜6MYa Human(?) Chimpanzee Phylogeny of Hominidae
Pongo (Orangutan) Outgroup Gorilla Pan (Chimpanzee) LCA Homo Time (LCA: The Last Common Ancestor) Cladistic inference Homo ACGTGTTTGAAATATTACTGATTGTAA Pan ACGAGTTTGAAATATTATTGATTGTAA Gorilla ACGTGTTTGAATCATTATTGATTGTAA Orangutan ACGTGTTTAAATTATTATTGGTTGCAA LCA ACGTGTTTGAAATATTATTGATTGTAA
Species-specific insertion-deletions Human Chimpanzee Gorilla Orangutan * positive amplification found for both chimp and human template DNA
Pt Hs Gg Pp 1900 980 Pt Hs Gg Pp 1 2 3 4 1 2 3 4 1 1 2 Example 1 Deletion in Human Lineage Example 2 Insertion in Human Lineage 1 2 3 4 1 2 3 4 1 1 2 1 2 3 4 1 2 3 4 1 1 2 4200 2900 106 106 117 Example 3 Deletion in Chimp Lineage Example 4 Allelic Deletion in Chimp Lineage Pt Hs Gg Pp Pt Hs Gg Pp 1 2 3 4 1 2 3 4 1 1 2 1 2 3 4 1 2 3 4 1 1 2 2400 4200 1200 1300 154 129
Human chromosome 21 gene catalog • 284 genes • 223 known • 19 novel CDS • 25 novel transcripts • 12 putative • 5 predicted • 85 pseudogenes
Gene catalog comparison • We lacked information for 6 genes located in sequencing gaps • 6 hsa21 genes are absent from the ptr22 sequence (H2BFS, 5 KAP genes from the 21q22.1 cluster) • 4 hsa21 genes appear to be pseudogenes in chimp • 3 ptr22 pseudogenes are absent from the hsa21 sequence • 1 hsa21 pseudogene has a complete ORF in ptr22
ORF comparison • 83% of genes have at least one amino acid replacement • 10% of the potential ptr22 proteins are predicted to have a different length • Amino acid insertion or deletion • Different start codon • Different stop codon • Other, more complex rearrangement
Amino acid length differences • Shorter in chimp: ADAMTS5 • Longer in chimp: C21orf30
17 bp deletion in chimpanzee • Human and chimpanzee splice sites are different • Splice-site diversity Complex rearrangement: TCP10L
FLJ32835 C21orf9 C21orf71 TCP10L C21orf96 Sequence identity The human chr21 genes ordered according to their chromosomal position Gene conservation
Species-specific amino acid replacements Chimp-specific replacements BACE2 TIAM1 BACH1 FAM3B C21orf33 ADAMTS1 C21orf103 ITGB2 HLCS DNMT3L IFNGR2 PPIA3L C21orf59 MRPL39 CLDN17 KRTAP11-1 CCT8 DSCR2 TFF2 BTG3 HSF2BP C21orf115 Human-specific replacements • KIAA0184 • COL6A2 • HUNK • AGPAT3 • DSCR3 • PWP2H • STCH • SLC5A3 • CHAF1B • SIM2 • KCNE2 • APP • C21orf98 • C21orf61 • IFNAR1 • UBASH3A • TMPRSS3 • DSCR1 • C21orf7 • ADARB1 • TSGA2 • IFNAR2 • C21orf63 • KCNE1 • C21orf2 • C21orf55 • ATP5A • CLDN8 • C21orf56 • DNMTA1
GO categories with highest divergence rates in hominids Chimpanzee Sequencing & Analysis Consortium. Nature (205) 437:69-87
Evolutionary transcriptomics Correralate phenotype with genotype Using Affymetrix arrays it could be shown thatthe amount of transcript/gene varies in a species-specific manner (Enard et al. 2001). -> What DNA sequence differences are responsible for the observed differences in transcript-levels?
Multiple probes per gene Transcription start site (TSS) 3‘UTR 5‘UTR Promoter • Transcriptional control • RNA stability Enhancer
ANNOTATED GENES DETECTED GENES UPREGULATED (IN HUMAN) DOWNREGULATED (IN HUMAN) Probes mapped to human chr21 237 genes annotated for chromosome 21 189 represented on the affymetrix A-E arrays
Gene expression profiling • 189 annotated genes represented on the Affymetrix A-E arrays (Hellmann, Pääbo)