Download
1 / 59
590 likes | 691 Views
Starter Questions. Q1. Convert to 12 hr clock. 20 23. 05 32. Q2. Round to 1 decimal place 0.657. Q3. How many minutes in a day. Q4. Find the time difference between 16 29 and 22 17. Learning Objective. Revision: Predict outcomes from data using the language of chance and likelihood.

E N D
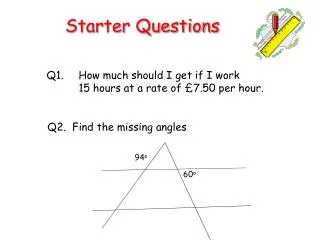
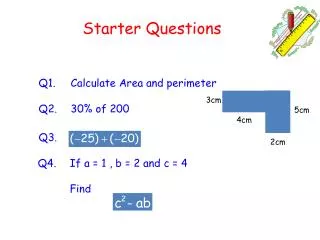
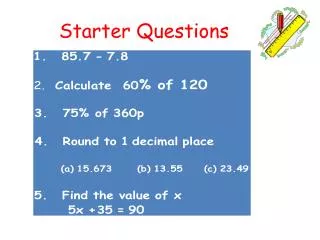
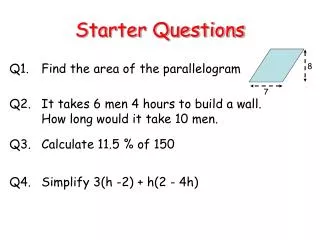
Starter Questions Q1. Convert to 12 hr clock 20 23 05 32 Q2. Round to 1 decimal place 0.657 Q3. How many minutes in a day Q4. Find the time difference between 16 29 and 22 17
Learning Objective Revision: Predict outcomes from data using the language of chance and likelihood.
Certain Something will definitely happen. Likely Something will probably happen, but it is not certain. 50:50 Chance Something has exactly half a chance of happening. Something is unlikely. It has more chance of not happening. Unlikely Probability. What are the chances of that? Impossible Something will never happen. Probability is all to do with how likely, or unlikely events are to happen.Click on the words to see what they mean.
Click on the statements to watch them being placed on the probability line It will snow in May 2012 is a leap year Year 5 will get homework It will rain in April The sun rises in the west Burnley win the FA Cup The moon orbits Earth Xmas will be in March Pick red card from a deck A coin lands on heads Certain Likely 50:50 Chance Unlikely Impossible
Probability Number Line ½ or 50% chance ¾ or 75% chance Certain 100% chance Impossible 0% chance ¼ of 25% chance Reveal Reveal Reveal Reveal Reveal • Rolling 7 on an ordinary 6 sided dice • Choosing one Year Group in a Junior School (Years 3 to 6) • Rolling an odd number on a dice • Choosing a red counter from a bag that has 6 red and 2 blue counters in it. • Choosing any card other than an Ace from a pack of cards
Probability Spinners There is a ¼ (25%) chance of the spinner landing on red. There is a ½ (50%) chance of the spinner landing on blue. There is a ¼ (25%) chance of the spinner landing on green. Click on the colour to find out the probability of the spinner landing on it.
There is a ¼ chance (25%) of the spinner landing on blue. There is a 1/8 chance (12.5%) of the spinner landing on yellow. There is a 1/8 chance (12.5%) of the spinner landing on red. There is a 3/8 (37.5%) chance of the spinner landing on green. There is a 1/8 chance (12.5%) of the spinner landing on purple. Click on the colour to find out the probability of the spinner landing on it.
Add red ball Add yellow ball Add green ball Add blue ball Clear All
Probability Number Cards.Massimo has eight number cards in his hands. This is what he has: 1 4 3 2 7 7 2 7 Which number is most likely to come up? Is it more likely to pick an even or odd number? 7 Odd (5/8) What are the chances of picking 2? What are the chances of picking 1 or 3? ¼ chance ¼ chance
Reveal the CardClick on the card to reveal what it is 4 ? 9 ? ? 4 5 ? ? 9 • There is a ½ chance the number is odd • There is 1/10 chance the card is 2 • It is twice as likely to pick a 4 than a 2. 5 ? ? 2 ? 8 ? 5 ? 8 • There is 1/5 chance of picking an 8. • There is a 7/10 chance of picking a number 5 or more.
Starter Questions 124o
Learning Objective Revision: Interpreting Bar Charts
Approximately, how many people watched Swansea? Different football clubs have different attendances. This graph shows the average attendance for each club. 12,000 7,900 How many more people watched Bristol City than Brighton? 10,000 8,000 2,800 approx 6,000 Which club had about 7,300 watching them? 4,000 Barnsley 2,000 How many people watch Torquay? 0 1,800 approx Barnsley Brighton Swansea Torquay Bristol City
Data Data is information Data handling is when we organise, display and try to understand information.
Some children wanted to find out about the length of songs. They wanted to know how long most songs were. They listened to some songs and timed how long each one lasted
Here are their results: • 3min 20 seconds • 2 min 58 seconds • 3 min 12 seconds • 1 min 59 seconds • 4 min 03 seconds • 2 min 15 seconds • 3 min 32 seconds • 3min 37 seconds • 3 min 58 seconds • 1 min 45 seconds • 3 min 0 seconds • 3 min 13 seconds • 2 min 35 seconds • 3 min 17 seconds
Not very easy to understand is it? Let’s turn it into a graph...
Graph showing how many songs there were of each length Oh dear.... That wasn’t much help Number of songs Length (in minutes)
Every song is different... So how can we find out what sort of length is most common? We can group the data We’ll start by sorting it into a tally chart
3min 20 seconds • 2 min 58 seconds • 3 min 12 seconds • 1 min 59 seconds • 4 min 03 seconds • 2 min 15 seconds • 3 min 32 seconds • 3min 37 seconds • 3 min 58 seconds • 1 min 45 seconds • 3 min 0 seconds • 3 min 13 seconds • 2 min 35 seconds • 3 min 17 seconds
Remember how we tally in fives: So how many does this tally show? 18
Right, let’s get back to that tally chart... ... and change it into a frequency table
Tally chart Frequency table
Well, that bit was easy! Now let’s display the information in a pictogram
Now we can use those symbols to make a pictogram What else do we need? Song length = 2 songs Number of songs
We can show the same information in a graph: Which length of song is the most common? 8 6 4 Number of songs 2 3 min to 3 min 29 sec This is called the mode Song length
True or false? Most songs are between 3 and 4 minutes long. 8 6 4 Number of songs 2 True Song length
Grouping data When you group data, you have to make all the groups equal. In this example, all the groups were 30 seconds long. The same rule applies to any grouped data. If we were grouping tables test scores, we could use: 0-10, 11-20, 21-30, 31-40 and so on.
Starter Questions Q1. Solve the equation below ao Q2. Find all the missing angles bo Q3. Find the average of the numbers below 2,5,6,7,5,2,2,5,6,7,5,8 Q4. Find
Learning Objective Revision: Plot information on a line graph. Interpret data using a line graph.
Creating a Graph Here is some information that will need a different type of graph As this couple have two sets of numbers the best graph to draw is a line graph. This will help us to find out where we were at times like 10:45 too! Go to the next slide to see the graph. We timed the journey to our holiday destination. Here are our results:
80 60 Miles Travelled 40 20 0 12:00 11:00 11:30 9:00 9:30 10:00 10:30 Time of Day
Creating a Graph Here is some more information As this girl has two sets of numbers the best graph to draw is a line graph. This will help us read the temperature for the ‘odd number’ minutes too! Go to the next slide to see the graph. I timed how long it would take for the ice cubes to melt. Here are my results:
Start 85° 80° Water Temperature 75° 70° 65° 60° 55° Start 2 Mins 4 Mins 6 Mins 8 Mins 10 Mins 12 Mins Time
Interpreting GraphsSam measured his pulse as he did different exercises 90 80 Beats per minute What was Sam’s pulse after 1 minute? 70 How many minutes had passed when his pulse was 75? Between which minutes was Sam doing the hardest exercise? 60 What was Sam’s pulse at the start and end? 50 6 mins Time 4 mins 5 mins 0 mins 1 min 2 mins 3 min
Interpreting GraphsGeorgia measured the temperature outside for a day. Start 12° 10° Temperature 8° 5° 4° What times was it when the temperature was 8° What was the temperature difference between the coldest and warmest times of day? What was the temperature at 11am? What time of day was it the warmest? 2° 0° 8am 10am 12pm 2pm 4pm 6pm 8pm Time of Day
Starter Questions Q1. Calculate 105o Q2. Find all the missing angles Q3. List the prime numbers between 50 and 60 Q4. Find
Learning Objective Revision: Interpret and compare pie charts.
Pie Charts Show Pie Chart I asked my class of 25 children what their favourite pet was. Here are their results:
A pie chart to show Year ‘s 6’s favourite TV programmes If 8 children liked Coronation Street, estimate how many children like Emmerdale? How many children are in Year 6 ? Estimate how many children like watching films.
Questions Based on a Pie Chart: Favourite Subjects Which subject is the least popular? Literacy 16 children like P.E. How many children like D.T.? 8 children Estimate how many children like Art. 2-4 children How many children are in the class? 32 children
Every Graph tells a Story The temperature throughout the year! Temperature Summer Months Winter months Months of the Year What do you think this graph is about?
Every Graph tells a Story The kettle boils and turns itself off A kettle boiling! The kettle heats up The water steadily and slowly cools down. Temperature Time What do you think this graph is about?
Every Graph tells a Story The parachutist is in the aeroplane A parachutist! He jumps out the plane. He opens the parachute Height He safely reaches the ground. Time What do you think this graph is about?
Every Graph tells a Story The noise level on the playground! Play time. Noisy children! Lunchtime Sound Level (Decibels) Lesson time. The playground is quiet. 12:30 10:30 Time of Day What do you think this graph is about?
Every Graph tells a Story Pulse rate before, during and after exercise! Exercising The pulse rate returns to normal. Exercise Stops Pulse Beforeexercise Time What do you think this graph is about?
Every Graph tells a Story The story of bathtime! Person stays in the bath Tap is turned off Water drains away Person climbs out of the bath Person climbs into the bath Water Level Filling the bath with water Time What do you think this graph is about?
Starter Questions Q1. Which letter has half-turn symmetry 7 7 Q2. Find all the missing angles 7 Q1. Name 2 equilaterals that have all angles equal. Q1. Find