Download
1 / 38
380 likes | 509 Views
DEVELOPING AN EXPERT SYSTEM FOR GP IMPLEMENTATION. RUBY PINEDA-HENSON Department of Industrial Engineering Holy Angel University-Angeles City, Philippines hensonrp@datelnet.net ALVIN B. CULABA Department of Mechanical Engieering

E N D
DEVELOPING AN EXPERT SYSTEM FOR GP IMPLEMENTATION RUBY PINEDA-HENSON Department of Industrial Engineering Holy Angel University-Angeles City, Philippines hensonrp@datelnet.net ALVIN B. CULABA Department of Mechanical Engieering De La Salle University-Manila, Philippines coeabc@mail.dlsu.edu.ph
OUTLINE OF PRESENTATION • INTRODUCTION • RATIONALE FOR GP MODEL • EXPERT SYSTEMS METHODOLOGY • GP MODEL DEVELOPMENT • APPLICATION TO GP ANALYSIS OF SEMICONDUCTOR ASSEMBLY/PACKAGING • CONCLUSION/ RECOMMENDATION
GREEN PRODUCTIVITY PARADIGM FRAMEWORK FOR CONTINUOUS IMPROVEMENT PRODUCTIVITY IMPROVEMENT FOUNDATION FOR SUSTAINABLE DEVELOPMENT ENVIRONMENTAL PERFORMANCE
RATIONALE FOR GP MODEL • LIFE CYCLE ASSESSMENT - THE TECHNICAL FRAMEWORK • ANALYTIC HIERARCHY PROCESS- MULTICRITERIA DECISION MAKING(MCDM) MODEL AND TOOL
LIFE CYCLE ASSESSMENT • Streamlined LCA • Process-Based • Phased Approach • Inventory Analysis • Impact Assessment • Improvement Assessment
INVENTORY ANALYSIS IMPACT ANALYSIS IMPROVEMENT Analysis EMISSIONS TO AIR 1 Raw Materials INPUTS UNIT PROCESSES EMISSIONS TO WATER OUTPUTS IMPACTS IMPROVEMENT TECHNIQUES GREEN PRODUCTIVITY INDICATORS 2 IMPACT 1 Energy EMISSIONS TO LAND OPTION 1 3 IMPACT 2 Ancillary Materials OTHER RELEASES OPTION 2 n IMPACT 3 GREEN PRODUCTIVITY PERFORMANCE PRODUCTS/ COPRODUCTS OPTION 3 IMPACT 4 OPTION 4 IMPACT 5 OPTION j IMPACT i
ANALYTIC HIERARCHY PROCESS • Pairwise Comparison • Mechanism For Consistency Check • A Panel Of Experts May Be Utilized • Geometric Means Of Comparison Ratings
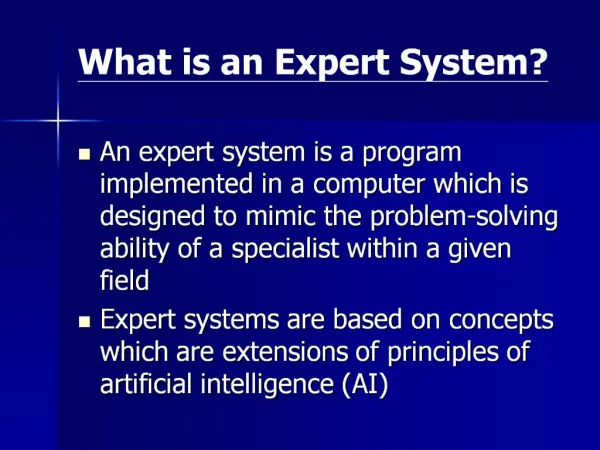
EXPERT SYSTEMS TECHNOLOGY • The potential of expert system technology is explored to develop a software that emulates how human experts diagnose GP performance of manufacturing processes.
Expert systems (ES) are computer programs that use expert knowledge and heuristics or rules of thumb to solve problems in a specific domain.
Complex decision analysis may involve an intricate combination of facts and heuristic knowledge which is organized into three distinct components: • Knowledge Base • Working Memory • Inference Engine
GP DIAGNOSTIC SOFTWARE • Front-end database system (Visual FoxPro) • Windows shell program/interface • CLIPS (CLanguage Integrated Production System) expert system • The shell program embeds the ES. The Dynamic Data Exchange (DDE) feature of Windows operating environment is used to transmit data to and from the two program ends.
GP MODEL DEVELOPMENT • Sub-Models • Inventory Analysis • Impact Analysis • Improvement Analysis • Green Productivity Assessment
Knowledge Base Inventory Analysis ------------------------- Input Data Output Data Environmental Impact Analysis ------------------------- Classification Valuation Productivity Improvement Analysis ------------------------- Classification Valuation Green Productivity (GP) Assessment ------------------------- GP Ratios GP Indices Figure 2. Green Productivity ES Model Structure Multicriteria Decision Analysis (Analytic Hierarchy Process) Input - Output Analysis
DIAGNOSTIC MODEL FEATURES • The inventory module prompts the user for inventory data on the manufacturing process. • The diagnostic module, through an embedded expert system program, performs impact classification on the inventory data.
In impact classification, pseudo-rules which are asserted as facts in the knowledge base links an input or output indicator substance found in the inventory to an impact category or classification. For example: IF [process input deionized water] and [deionized water >0] THEN [environmental impact water resource depletion] IF [process output mold runners] and [mold runners >0] THEN [environmental impact terrestrial ecotoxicity] EXAMPLE
Reads environmental impact and improvement priority weights from AHP calculations as well as green productivity performance ratios and indices. • Using an interface program between the database and the expert system, knowledge processing is performed on the passed parameters
The output consists of diagnostic advice on the result of inventory analysis, impact assessment, improvement assessment and green productivity assessment.
APPLICATION TO GP ANALYSIS OF SEMICONDUCTOR ASSEMBLY/PACKAGING
PROCESS INVENTORY ANALYSIS IMPACT ANALYSIS IMPROVEMENT ANALYSIS INPUTS UNIT PROCESSES OUTPUTS IMPACTS IMPROVEMENT TECHNIQUES PERFORMANCE INDICATORS WATER RESOURCE DEPLETION Conceptual Framework for Green Productivity Analysis Applied to Semiconductor Assembly/Packaging MATERIAL -BASED ENERGY -BASED ENERGY RESOURCE DEPLETION GREEN PRODUCTIVITY PERFORMANCE PROCESS -BASED HUMAN TOXICITY: Air emission EMISSIONS TO AIR PRODUCT -BASED 1 Raw Materials HUMAN TOXICITY: Land emission EMISSIONS TO WATER 2 MANAGEMENT -BASED Energy EMISSIONS TO LAND HUMAN TOXICITY: Water emission 3 Ancillary Materials OTHER RELEASES ECOTOXICITY: -Aquatic n PRODUCTS/ COPRODUCTS ECOTOXICITY - Terrestrial
Wafer DI Water FIRST LEVEL ASSEMBLY DIE PREPARATION LEGEND Input/ Product Waste/ emission Reuse/ Recycle Leadframe Die Waste Water DIE ATTACH Ancillary Processes Semiconductor Assembly/ Packaging Process Flowchart WASTEWATER TREATMENT DEIONIZED WATER PRODUCTION Used Solvent FLUX CLEAN Waste Water Reuse DI Water MOLD/ POST MOLD SOLDER PLATE / POST SOLDER CLEAN FINAL TEST, MARK, PACK Semiconductor product
PROCESSES • DIE PREPARATION • FIRST LEVEL ASSEMBLY • DIE ATTACH • FLUX CLEANING • MOLDING/POSTMOLD CURE • SOLDER/POST SOLDER CLEAN • TESTING
INVENTORY DATA • SCENARIO 1 : BASE PERIOD • SCENARIO 2 : PLC MODIFICATION IN THE MOLDING PROCESS
SEVEN IMPACT CLASSIFICATION • WATER RESOURCE DEPLETION -WRD • ENERGY RESOURCE DEPLETION-ERD • HUMAN TOXICITY ON AIR - HTA • HUMAN TOXICITY ON WATER - HTW • HUMAN TOXICITY ON LAND - HTL • AQUATIC ECOTOXICITY - ETA • TERRESTRIAL ECOTOXICITY - ETT
IMPROVEMENT TECHNIQUES • MATERIAL-BASED (MBT) • ENERGY-BASED (EBT) • PROCESS OR • EQUIPMENT-BASED (PET) • PRODUCT-BASED (PBT) • MANAGEMENT-BASED (MGMT)
Level 1 Goal : Green Productivity GREEN PRODUCTIVITY OF SEMICONDUCTOR ASSEMBLY / PACKAGING Decision Hierarchy Structure for Green Productivity Analysis of Semiconductor Assembly/Packaging Level 2 Factors: Impact Water ResourceDepletion Energy ResourceDepletion Human Toxicity Air Human Toxicity Land Human Toxicity Water Ecotoxicity Aquatic Ecotoxicity Terrestrial Level 3 Alternative /Schemes: Improvement Techniques Material Based Energy Based Process Based Product Based Management Based
Aj = Wi Kij i = 1, 2, …n impact factors j = 1, 2, …m options where Wi = the relative weight of impact factor i with respect to the over-all goal Kij = relative weight of option j with respect to impact i Aj = priority weight of option j.
GREEN PRODUCTIVITY INDICATORS • BASED ON MATERIAL/ENERGY UTILIZATION: • Water Utilization Ratio (MUR) = • kg product /kg water input
BASED ON ENERGY UTILIZATION: • Energy Utilization Ratio (EUR) = • kg product/kWh energy input
SPECIFIC WASTE OR EMISSION RATIOS • BASED ON WASTE MINIMIZATION: • Waste Ratio or Emission Ratio (WR/ER) = • kg waste or emission/kg total material input
GREEN PRODUCTIVITY INDEX • GP INDEX OF “1” IS ASSIGNED TO THE BASE PERIOD AND GP INDEX FOR TEST SCENARIO IS DETERMINED
FOR TEST SCENARIO • FOR MATERIAL/ENERGY PRODUCTIVITY: • IF GP INDEX > 1 , GP IMPROVEMENT • IF GP INDEX <1, GP DECLINE • FOR WASTE OR EMISSION INDICES: • IF GP INDEX > 1 , GP DECLINE • IF GP INDEX < 1 , GP IMPROVEMENT
CONCLUSION/RECOMMENDATION • The assessment methodology and computerized diagnostic prototype may be utilized as an internal management or self-assessment tool by companies in their continuous GP improvement strategies. • The application of expert systems technology is particularly appropriate to provide flexibility in testing assumptions and in preserving valuable human expertise on green productivity implementation in the manufacturing industry.
Enhancements may be made in future versions with more powerful analysis engine, sufficient database and comprehensive scope of GP analysis to include all life cycle stages.
ACKNOWLEDGEMENT • Asian Productivity Organization (APO) for the materials on Green Productivity • Semiconductor and Electronics Industries of the Philippines (SEIPI) and the Association of Electronics and Semiconductors for Safety and Environment Protection (AESSEP) for their favorable endorsement of the study to some member-semiconductor companies which provided the necessary data and information for this research.