Download
1 / 12
160 likes | 1.23k Views
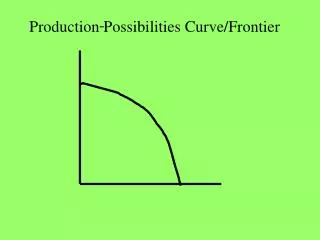
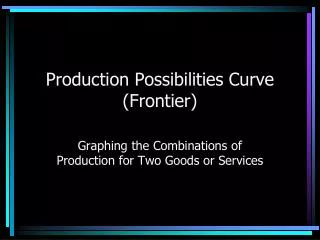
Production Possibilities Curve. Production Possibilities Curve. Constant Opportunity Cost. Decreasing Opportunity Cost. Absolute Advantage and Comparative Advantage. ABSOLUTE ADVANTAGE

E N D
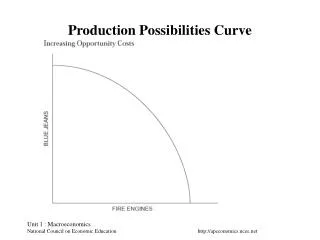
Production Possibilities Curve Unit 1 : Macroeconomics National Council on Economic Education
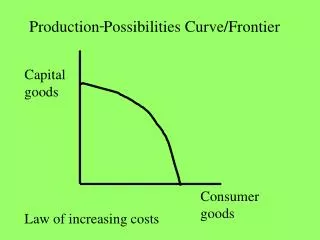
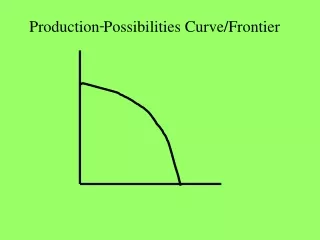
Production Possibilities Curve Constant Opportunity Cost Decreasing Opportunity Cost Unit 1 : Macroeconomics National Council on Economic Education
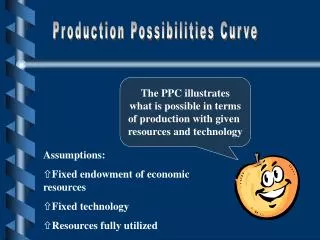
Absolute Advantage andComparative Advantage • ABSOLUTE ADVANTAGE One individual or nation can produce more output with the same resources as another individual or nation. • COMPARATIVE ADVANTAGE One individual or nation can produce a good at a lower opportunity cost than another • EXAMPLES OF COMPARATIVE ADVANTAGE Economics professor and secretary Auto mechanic and medical doctor Unit 1 : Macroeconomics National Council on Economic Education
Determining ComparativeAdvantage (Output Method) • Which nation has an absolute advantage in producing corn? • Which nation has an absolute advantage in producing sunscreen? • Which nation has a comparative advantage in producing corn? • Which nation has a comparative advantage in producing sunscreen? • Should Mexico specialize in corn or sunscreen? • Should France specialize in corn or sunscreen? Unit 1 : Macroeconomics National Council on Economic Education
Movement Along a Demand Curve As the price declines from P to P1, the quantity increases from Q to Q1 Unit 1 : Macroeconomics National Council on Economic Education
Shift in Demand • Factors that Shift Demand: • Number of Consumers • Price of complementary good • Price of substitute good • Consumer income • Expectations about income or prices Increase in demand from D to D1 shows that at the same price (P), the quantity increased from Q to Q1 Unit 1 : Macroeconomics National Council on Economic Education
Movement Along a Supply Curve As the price declines from P1 to P, the quantity decreases from Q1 to Q. Unit 1 : Macroeconomics National Council on Economic Education
Shift in Supply • Factors that Shift supply: • Number of suppliers • Prices of resources used to produce good • Prices of related goods produced • Technology • Expectations about future prices Increase in supply from S to S1 shows that at the same price (P), the quantity increased from Q to Q1. Unit 1 : Macroeconomics National Council on Economic Education
Equilibrium Quantity and Price What happens if the price is $10? What happens if the price is $6? What happens if the price is $8? Unit 1 : Macroeconomics National Council on Economic Education
Calculation of Price Elasticity of Demand Unit 1 : Macroeconomics National Council on Economic Education
Price Elasticity along a Demand Curve Unit 1 : Macroeconomics National Council on Economic Education
Effects of Different Demand Elasticities Which demand curve is more inelastic? What happens to the equilibrium price and quantity with an elastic demand curve if supply increases? What happens to the equilibrium price and quantity with an inelastic demand curve if supply increases? Unit 1 : Macroeconomics National Council on Economic Education