CLIO INFRA
610 likes | 881 Views
CLIO INFRA. Jan Luiten van Zanden Utrecht University/Groningen/Stellenbosch. Economic history and the ‘beyond GDP’ debate. Our view of the long-term development of the world economy is largely based on GDP estimates (Maddison synthesis)

CLIO INFRA
E N D
Presentation Transcript
CLIO INFRA Jan Luiten van Zanden Utrecht University/Groningen/Stellenbosch
Economic history and the ‘beyond GDP’ debate Our view of the long-term development of the world economy is largely based on GDP estimates (Maddison synthesis) National accounts has been very fruitful approach for understanding and interpreting development world economy since 1800
Economic history and the ‘beyond GDP’ debate But limitations of GDP are also well known (inequality, sustainability) Can economic history offer historical dimension to well-being debate? Is picture of development of world economy really different if we move to more inclusive measures of well-being?
Structure presentation Introduction: Clio Infra Method: how to ‘create’ large global datasets covering the world economy 1500-2010 It is possible to reconstruct long term development of various dimensions of well-being? Does it really matter? Does it produce a different picture of the rise and development of global inequality?
Clio Infra: large scale research infrastructure project Aim: to create the research infrastructure for the analysis of global inequality Better estimates of the ‘usual’ indicators (such as GDP) Alternative indicators: real wages, life expectancy, biological standard of living, ‘agency’ (Sen) Datasets about proximate and ultimate causes of growth and stagnation: human capital, institutions, family systems, culture and religion, knowledge production (books?), geography etc. How does growth affect sustainability? For the period 1500-2010, for the whole world
Approach CLIO INFRA Set of specialized hubs that produce global datasets Central website at International Institute for Social History (IISH) Cooperation with Gapminder and Statplanet And with Data Archive DANS for datastorage
CLIO INFRA Total budget 4.2 M€ For 2011-2014 Stages: 2011: design central hub, and requirements of data uploaded from datahubs December 2012: first version on-line available: first sets of data from hubs 2012/2013: work on datasets and on refinements central hub 2014: ‘final’ version of all websites
CLIO INFRA consists of Thematic datahubs: National Accounts: the Maddison project (Groningen) Biological Standard of Living and Age heaping (Tuebingen) Human Capital Formation (Debrecen/Utrecht) Demography, Gender, Labour Status (IISH) Prices and Wages (IISH) Institutions & Agency (UU) Sustainability (UU)
Example: the Maddison project Collaboratory: team of scholars working on same topic, for example estimating GDP on global scale (Maddison network) How to continue with this work in the post-Maddison period? Two-layered organization: working group of four ‘disciples’ (Bart van Ark, Leandro Prados, Debin Ma, Jan Luiten van Zanden) Broader advisory board with all specialists (25) covering regions and periods Website: http://www.ggdc.net/maddison/maddison-project/index.htm
Example: Maddison project Conference in November 2010 How to proceed: we take Maddison dataset as starting point What are weak and strong points (assessment: 4 categories)? New work to be included (for example England and Holland before 1800) Working group collects new estimates and produces working paper (Bolt and Van Zanden 2012; Van Ark and De Jong 2012) Session Stellenbosch 2012 to discuss new results – then (maybe) launched on internet
Example: Maddison project Core problem of collab: how to collect and integrate into one consistent set of estimates dispersed expertise of dozens (economic) historians Standardization; peer review; data availability Via ‘layered’ teamwork: Maddison project, labour status project IISH
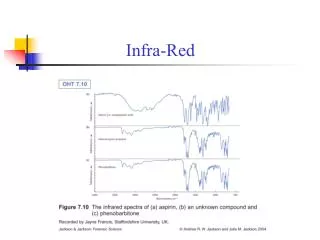
GDP per capita from about 1300: England, Netherlands, Indonesia
Other dimensions of well-being • Demography: Life Expectancy • Biological standard of living • Sustainability • Institutions and Gender • Human Capital • Inequality
Other hubs: Biological standard of living: heights in world economy (men, birth cohorts, in cm) (Baten/Tuebingen)
Human Capital Hub: educational attainment (England 1300-1900)
Sustainability hub (with HYDE, PBL): a.o. biodiversity and emissions
Institutions hub: quality of political institutions (PolityIV)
Institutions hub: quality of political institutions before 1800
Institutions hub: quality of political institutions before 1800
Various dimensions of inequalityGlobal Income Inequality 1820-2000 GDP per capita
The aim: various dimensions of inequalityInstitutional inequality(polityIV)
New Results: is it possible to go beyond GDP as measure of welfare? HDI index – can we extend this into pre 1850 period (for large parts of world economy)? Can we broaden the concept of ‘well-being’ and include other dimensions as well Stiglitz, Sen & Fitoussi (Sarkozy-report) Measuring well-being by OECD (Better Life Initiative)
Problems and limitations • Conceptual issues; what exactly are we measuring? • No ‘subjective’ indices, no interviews, difficult to use very specific indicators • But expert opinion can sometimes replace this (polityIV dataset) • Use of smart proxies • But: crude estimates, big gaps in sources
From GDP to HDI Per capita GDP/GNI (PPP) Life expectancy at birth Literacy/Average years of education Changes in measures, goalpost, and aggregation This all can and is measured for large parts of world economy 1500-present
Two additions considered here • Political rights & civil liberties • Currently not done, but elephant in room • HDR 1991, 1992, 2000 • Dasgupta & Weale, 1992 • Gender equity • Women frequently lack freedom • Done for present: Gender Development Index (GDI) and Gender Inequality Index (GII • Sen, World (Bank) Development Report 2012; Duflo: smart economics, good outcome in its own right
Gender Equity • GDI has high data requirements: • life exp. by gender • educational attainment by gender • income by gender • To make life easier, UNDP replaced it with GII • maternal mortality • adolescent fertility • parliamentary seats by gender • educational attainment by gender • labour force participation by gender
Political & civil rights • UNDP tried in 1991-2 • Lots of criticism • Undemocratic countries did not like it • Humana/The economist’s index insufficient, too subjective, biased
Goalposts for new variables Translate to 0-1 scale Polity IV: minimum and maximum exists throughout, e.g. present-day Saudi-Arabia, Australia SMAM: 12.5 (India, 1925) and 33.66 (Saint Lucia, 1991)