Download
1 / 49
490 likes | 630 Views
Art. Understanding Markets and Marketing: Introduction. Randy Fortenbery. School of Economic Sciences College of Agricultural, Human, and Natural Resource Sciences Washington State University. The objective of marketing is:. NOT to make money in the futures market.

E N D
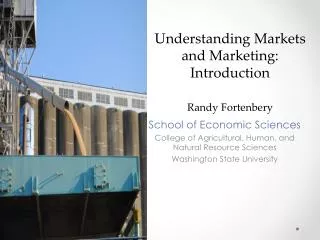
Art Understanding Markets and Marketing: Introduction Randy Fortenbery School of Economic Sciences College of Agricultural, Human, and Natural Resource Sciences Washington State University
The objective of marketing is: • NOT to make money in the futures market. • NOT to sell at the highest price of the year. • NOT to generate accurate price forecasts. • TO earn a reasonable return on investment • TO minimize the risk associated with achieving a target level of income.
Wheat as a Feed Grain Wheat prices over the last year or so have been supported by feed demand
Feed Demand Summary • Cattle numbers are declining because of drought conditions in the Southern Plains. • Dairy margins are stressed. • Corn feed demand was currently projected to be down about 2 percent from last year.
Volatility Perceptions Biofuel production has driven up commodity prices, and increased commodity price volatility.
Actual Corn Price Compared to Price Expected from Supply/Demand System
Current Ethanol Situation • The current renewable fuels standards limits corn based ethanol to contributing 15 billion gallons towards the 35 billions gallon target by 2022. Production in 2011 was about 14.2 billion gallons. • Blending subsidy of 45 cents per gallon eliminated in 2012, as well as 54 cent per gallon Brazilian import tariff. • Less important driver of corn prices moving forward, and not and important driver of price volatility.
Volatility Perceptions Speculative activity in the derivative (especially futures) markets has resulted in increased price volatility and inefficient price discovery.
Empirical Evidence • Work by the CFTC looking at 2008 oil prices suggested that speculators were not the cause of either price levels or price volatility • Similar results were found by Irwin et. al looking at soybean markets. • DESPITE THIS: Perception is driving policy.
Volatility Perceptions International economic events have become more important than basic market fundamentals in determining price levels and volatility.
Fundamentals Still Matter • Land Use • Asian Demand • International Production • Alternatives Uses
CRP Contract Expirations • Sept. 30 2009 2.8 million acres • Tx 561K, Colo 409K, Ks 331K, NDak 192, • SDak 184K, MT 138K • Sept. 30, 2010 4.5 million acres • Sept. 30 2011 4.4 million acres • Sept. 30 2012 6.5 million acres
CRP OBJECTIVES • Upland Bird Habitat 250,000 acres • Bottomland hardwood trees 500,000 acres • Non-flood plain wetlands 250,000 acres • Flood plain wetlands 500,000 acres • Longleaf pine plantings 250,000 acres • Prairie pot hole duck habitat 100,000 acres • State acres for wildlife 500,000 acres
Highlights of USDA’s 2012/13 Supply and Demand Estimates 1. 2012/13 Global wheat production estimated at 654 MMT, down 6% from 2011/12 – Global supplies estimate at 850 MMT; 44.0 MMT lower than 2011/12 – Black Sea production declines to 78 MMT due to weather problems, compared to 115 MMT in 2011/12 – Canadian production estimated at 27.2 MMT, up 8% from five-year average – US production rebounded 14% to 61.8 MMT 2. Consumption to decline for first time in five years, down 4% from 2011/12 – World feed use expected to decline 10 percent to 132 MMT 3. World wheat trade to fall 16% from 2011/12 to 132 MMT, below 5-year average of 138 MMT 4. 2012/13 world ending stocks at 177 MMT, down 10% from 2011/12 – China’s ending stocks (56 MMT) account for 31% of total 5. 2012/13 planted acreage higher than 2011/12 – U.S. wheat reached 55.7 million acres, up 3% from 2011/12 – Winter wheat acres 3% greater at 41.8 million acres – Durum acres up 61% to 2.2 million acres after a sharp decline in 2011/12 – Spring wheat acres down 3% to 12.0 million acres From: U.S. Wheat Associates
OUTLOOK • We have likely entered a sustained period of higher average prices, coupled with increased volatility. Sources of volatility vary, and policy strategies to “control” volatility are at risk of causing, not solving, concerns related to market risk. • Tensions between various use categories will result in considerable political pressure to manage who can and cannot engage in trade, especially in derivative and forward markets.
Conclusions We have likely entered a new pricing regime relative to basic commodity prices. Both price levels and price volatility will continue to exceed levels experienced through 2006/07. We will likely see several proposed “solutions” to commodity price activity initiated through political institutions. This will be a global phenomenon, and many of the proposals will be short-sighted and off target. Much of the political motivation for “managing” markets makes overly simplistic assumptions relative to causality. Creative risk management becomes important