Download
1 / 51
620 likes | 1.35k Views
Lesson 2: Terrestrial Coordinate System and Nautical Charts. Lesson 2: Terrestrial Coordinate System and Nautical Charts. AGENDA: Terrestrial Coordinate System (Lat/Long) Chart Projections Chart Interpretation/Scale. Applicable Reading:. Hobbs, Chapter 4. Earth: A “not-so-perfect” Sphere.

E N D
Lesson 2: Terrestrial Coordinate System and Nautical Charts • AGENDA: • Terrestrial Coordinate System (Lat/Long) • Chart Projections • Chart Interpretation/Scale
Applicable Reading: • Hobbs, Chapter 4
GEOGRAPHIC COORDINATE SYSTEM LATITUDE LONGITUDE
MEASUREMENT OF ARC • Positions in relationship to Earth’s Coordinates system are expressed in: PRONOUNCEDSYMBOL Degrees (°) Minutes (´) Seconds (´´)
LATITUDE PARALLELS 90 °N 80 °N 60 °N 40 °N 20 °N 0 ° Equator 20 °S 40 °S 60 °S 90 °S
Longitude: 0-180 West Longitude: 0-180 East Prime Meridian (Greenwich England) 0° Longitude Longitudinal Parallels
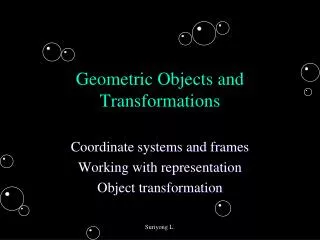
Terrestrial Coordinate System A Great Circle is defined as a line on the surface of sphere, formed by the intersection of a plane passing through it’s center.
Equator • The great circle formed by passing a plane perpendicular to the earth’s axis halfway between its poles. • The equator divides the earth into northern and southern hemispheres • One of the two great circles from which all locations on the earth’s surface are referenced.
Prime Meridian • The meridian that passes through the original position of the Royal Greenwich Observatory near London, England. • Constitutes the second reference line for the terrestrial coordinate system. • All other meridians are referenced to the prime meridian; it divides the earth into the eastern and western hemispheres.
Terrestrial Coordinate System A Small Circleis any other circle formed on the surface of a sphere by the intersection of a plane not passing through the sphere’s center.
Chart Production • Two government agencies are mainly responsible for producing nautical charts - the National Geospatial Information Agency and the National Ocean Service. • National Geospatial Information Agency (NGA) - concerned mainly with the production and upkeep of charts and related navigational publications covering all ocean areas of the world outside U.S. territorial waters. • NOAA/National Ocean Service - concerned with charts covering inland and coastal waters of the United States and its possessions.
TERMS AND DEFINITIONS CHART SCALE: THE RELATIONSHIP BETWEEN TWO MEASUREMENTS. EXPRESSED AS A RATIO. • THE SCALE TO WHICH A CHART IS DRAWN APPEARS DIRECTLY UNDER ITS TITLE.
TERMS AND DEFINITIONS • LARGE SCALE CHART COVERS A SMALL AREA AND ARE USED FOR PILOTING AND INSHORE NAVIGATION.
TERMS AND DEFINITIONS • SMALL SCALE CHARTS ARE LESS DETAILED THAN LARGE SCALE CHARTS AND COVER A LARGE AREA.
Chart Projections • Desirable qualities of a chart projection: • Maintain true shape of physical features. • Maintain correct proportions of features relative to one another. • True scale, permitting accurate measurement of distance. • Rhumb lines plot as straight lines. • Great circles plot as straight lines.
MERCATOR PROJECTION: • The Most Common Projection Used In Maritime Navigation. • Point Of Tangency Is The Equator. • Rhumb lines plot as STRAIGHT lines.
Mercator Projection © 1998 GeoSystems Global Corporation
ADVANTAGES Position, distance, and direction can all be easily determined Rhumb lines plot as straight lines Meridians plot as straight lines DISADVANTAGES Distortion of true size of surface features increases with distance from the equator Great circles, other than a meridian or the equator, appear as curved lines. Advantages/Disadvantages of the Mercator Projection
ADVANTAGES Great circles appear as straight lines. Uused to plot the optimum great circle route (shortest path) between two points DISADVANTAGES Distortion of shape and scale increases as the distance from the point of tangency increases. Distance and direction cannot be measured directly from a gnomonic projection. Advantages/Disadvantages of the Gnomonic Projection
Chart Projection Summary MercatorGnomonic Parallels: Straight lines Curved (except equator) Meridians: Straight Straight Conformal: YES NO Great Circles: Curved* Straight Rhumb lines: Straight Curved lines Applications: Piloting Great-circle determination * Except meridians
Measuring Direction • All rhumb lines on a Mercator projection represent true directions. • Measurement of direction on a Mercator chart is accomplished by using a parallel ruler to transfer the direction of a rhumb line to a nearby compass rose.
MEASURING DISTANCE Distance of 1 NM 1 Degree = 60 NM (Nautical Miles) 1 Minute = 1 Nautical Mile DISTANCE ALWAYS MEASURED ON LATITUDE SCALE!
TYPES OF CHARTS GENERAL CHARTS: • Small Scale Charts • 1:150,000 - 1:600,000 • Used for voyage planning.
TYPES OF CHARTS SAILING CHARTS: • Small Scale Charts • 1:600,000 - SMALLER • Used For Open Ocean Navigation.
TYPES OF CHARTS COASTAL CHARTS: • Large Scale Charts • 1:50,000 - 1:150,000 • For approaching bays and harbors and used for coastal navigation outlying reefs and shoals.
TYPES OF CHARTS HARBOR AND APPROACH CHARTS: • Large Scales Charts • 1:2,400-1:50,000 • Used Primarily For Inshore Navigation and for Navigating Large Inland Waterways.
CHART NUMBERING SYSTEM • Designed For Use By The U.S. Navy and U.S. Coast Guard. • Built by Defense Mapping Agency (DMA) who has changed it’s name to: NATIONAL GEOSPATIAL-INFORMATION AGENCY (NGA)
Chart Numbering System • All charts produced by NIMA and NOS are assigned a number from one to five digits, according to the scale and area they depict. # of digitsScale 1 No scale involved (supporting pub) 2 1 : 9,000,001 and smaller 3 1 : 2,000,001 to 1 :1,900,000 4 Miscellaneous and special, non-navigational charts 5 1 : 2,000,000 and larger • The chart numbering system also allows the navigator to organize his/her charts into chart portfolios.
ONE DIGIT CHARTS(1-9) • Have no Scale Connections. • Comprise The Symbol And Abbreviation For Charts of The United States And Other Nations.
TWO AND THREE DIGIT CHARTS • Covers Very Large Areas Such As: • Entire Ocean Basins • Portions of Ocean Basins. • The World’s Water Are Divided Into Nine Ocean Basins.
FOUR DIGIT CHARTS • Covers Numbers From 5000 to 9999 • Non-navigational, Special-purpose Charts Such As: • Special World Charts • Plotting Sheets
FIVE DIGIT CHARTS(11000-99999) • Covers Portions Of Coastlines. • Most Common Type of Charts By Navigators. • Majority of Nautical Charts Found Aboard Ships
CHART NUMBERING • The Five Digits Combined Make Up The Alpha-numeric (Words& Numbers) Prefix. • First Two Digits Are The Sub-region. • Third Digit Is The Portfolio Assignment Number.
PORTFOLIO ASSIGNMENT • “A” Portfolio Consist Of: • All Operating Area Charts • Principal Coastal Charts • Harbor And Approach Charts. The Navy Has Three Portfolio Assignments A, B, and X.
PORTFOLIO ASSIGNMENT • “B” Portfolios Supplement the “A” Portfolio With: • Additional Coastal Charts • Harbor And Approach Charts • For Each Sub-region.
PORTFOLIO ASSIGNMENT • “X” Portfolio: • Designated Standard Nautical Charts Which Have Not Been Assigned To Either an “A” Or “B” Portfolio.
CHART NUMBERING • The Fourth And Fifth Digits Of The Prefix Specify The Type Of Chart: “CO” - COASTAL CHARTS “HA” - HARBOR AND APPROACH CHARTS. “OA” - OPERATING AREA CHART “WO” - WORLD “NR” - NAVY RESTRICTED “GN” - GENERAL “TR” - TRAINING
NATIONAL GEOSPATIAL-INFORMATION AGENCY (NGA) NGA STOCK NUMBER • Note: The Complete NGA Stock Number Must Be Used When Requisitioning Charts And Publications.
CHART 12245 • (1) First Digit Of A Five Digit Chart Is The Region. • (12) First And Second Digit Combined Indicate The Sub Region. • (245) Last Three Digits Are Numbered COUNTERCLOCKWISE Around The Continents.
Chart Correction System • Chart corrections are disseminated via Notice to Mariners and Local Notice to Mariners. • Notice to Mariners - issued by NGA and contain changes relating to oceanic and coastal areas worldwide. • Local Notice to Mariners - issued by the U.S. Coast Guard districts and contain changes pertaining only to U.S. inland waters. • Navigators are not required to immediately enter changes on every chart. • Corrections are entered on correction cards when received. The navigator’s staff updates the charts when the ship is scheduled to operate in an area covered by the chart portfolio.