Download

1 / 55
570 likes | 1.29k Views
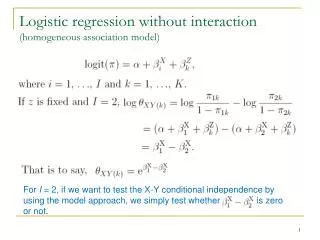
Lecture 9: Marginal Logistic Regression Model and GEE (Chapter 8). Marginal Logistic Regression Model and GEE. Marginal models are suitable to estimate population average parameters. For example, in the Indonesian study, a marginal model can be used to address questions such as:

E N D
Lecture 9:Marginal Logistic Regression Model and GEE(Chapter 8)
Marginal Logistic Regression Model and GEE Marginal models are suitable to estimate population average parameters • For example, in the Indonesian study, a marginal model can be used to address questions such as: • What is the prevalence of respiratory infection in children as a function of age? • Is the prevalence of respiratory infection greater in the sub-population of children with vitamin A deficiency? • How does the association of vitamin A deficiency and respiratory infection change with age? • The scientific objective is to characterize and contrast populations of children.
Marginal Models for Binary Responses:Logistic Regression Model for the Mean Model for the Association Marginal odds ratio,
Marginal Odds Ratio a greater value indicates positive association Two possible specifications: Degree of association is the same for all pairs of observations from the same subject Degree of association is inversely proportional to the time between observations from the same subject
Parameter Interpretation in Logistic Regression: ICHS Study Marginal Logistic Regression
Parameter Interpretation in Logistic Regression: ICHS Study Logistic Regression with Random Effects
Parameter Interpretation in Logistic Regression: ICHS Study Transition Logistic Regression Model
Parameter Interpretation in Logistic Regression: ICHS Study Transition Logistic Regression Model (cont’d)
Maximum Likelihood Estimation of β in GLM: Cross-sectional Data • If Yi is binary or a count, we specify the likelihood function and estimate the parameters of interest using Maximum Likelihood Estimation
Maximum Likelihood Estimation of β in GLM: Cross-sectional Data • For example, if Y is binary, i.e.: …we estimate β0 and β1 by maximizing
Maximum Likelihood Estimation of β in GLM: Cross-sectional Data • For example, if Y is a count, i.e.: …we estimate β0 and β1 by maximizing
Maximum Likelihood Estimation of β in GLM: Cross-sectional Data In general, we have: Solving the score equation is equivalent to maximizing the likelihood function. is called the score equation. Solutions to the score equation are not available in closed form, and so require an iterative procedure called iterative weighted least squares (IWLS)algorithm…
Maximum Likelihood Estimation of β in GLM: Cross-sectional Data Main ideas of IWLS • i = EYi, vi = var(Yi) = v(i) • Choose to make close to yi on average • Weight yi by vi-1
GEE Estimation of β in GLM: Longitudinal Data In the case of a linear regression model with the assumption of normality, the extension from ordinary linear regression to longitudinal problems was facilitated by thinking about a multivariate normal distribution. By specifying a model for the mean E[Yi] and the model for the covariance matrix Vi, we can fully specify the multivariate normal distribution: and use MLE.
GEE Estimation of β in GLM: Longitudinal Data Unfortunately, if the elements of Yi are counts or binary response, we cannot naturally extend the Bernoulli or Poisson distributions to take into account of correlation. Multivariate extensions of these distributions are quite complex (except for biostat students!). The main impediments with binary and count data are: • There are not multivariate generalizations of the necessary probability distributions • Population-average and subject-specific approaches do not lead to the same model for the mean response
GEE(applies only to marginal models) • Under a GEE approach, we forget about trying to specify a model for the whole multivariate distribution of a data vector. Instead, the idea is to just model the mean responseE[Yi] and the covariance matrix Viof a data vector as in the normal case. • GEE is based on the concept of “estimating equations” and provides a very general approach for analyzing correlated responses that can be discrete or continuous.
GEE • The idea behind GEE is to generalize and extend the usual likelihood equations for a GLM with a univariate response by incorporating the covariance matrix of the vector of responses Y • For the case of linear models, the Generalized Least Square (GLS) estimator for the vector of regression coefficients is a special case of the GEE approach
GEE • In the absence of a convenient likelihood to work with, it is sensible to estimate β by solving the following multivariate equation: • where Note: with continuous data, the estimate from this score equation reduces to the MLE
GEE (cont’d) • The method of generalized estimating equations provides consistent estimates for the mean parameter when a model for the correlation may not be reliably specified. • is a multivariate generalization of the score equation used to maximize the likelihood function under a GLM
GLM for Longitudinal Data (GEE) In summary: • For GEE models, we specify a GLM for the mean response • independence, completely unstructured • The estimates of β and their standard errors will be consistent (i.e. unbiased for large sample size). • If the specification of Vi is correct, then the GEE solution is the maximum likelihood estimate.
GEE One important property of the GLM family is that the score function depends only on the mean and variance of Yi. Therefore the estimating equation: can be used to estimate the regression coefficients for any choices of link and variance functions, whether or not they correspond to a particular member of the exponential family. is the generalized estimating equation.
GEE Properties • is nearly efficient relative to the maximum likelihood estimate of , provided that var(Yi) has been reasonably approximated. • GEE is the maximum likelihood score equation for multivariate Gaussian data, and for binary data, when var(Yi) is correctly specified. • is consistent for , even when var(Yi) is incorrectly specified.
What we need to specify for implementing GEE Model for the mean Known variance function Working correlation matrix: model for the pairwise correlations among the responses
Working covariance matrix V is called the working covariance matrix to distinguish it from the true underlying covariance of Y
GEE minimize GEE equations Solution of the GEE equation
Properties of GEE Estimates • The GEE estimator is consistent whether or not the within-subject associations/correlations have been correctly modelled. • That is, for the GEE estimator to provide a valid estimate of the true β, we only require that the model for the mean response has been correctly specified.
Asymptotic distribution of the GEE estimator • In large samples, the GEE estimator is multivariate normal True covariance matrix
Sandwich estimate of bread meat Consistent estimate of the true covariance matrix of Y
Link to stata command xtgee for continuous data substitute into GEE equations, to get… • xtgee, identity link, corr(exch) • Use Weighted Least Square for
Link to stata command xtgee for continuous data (cont’d) • xtgee, identity link, corr(exch), robust • Use Sandwich Estimator for
Link to stata commands xtgee for binary data • Substitute into GEE equation. But no closed-form solution, so need iterative procedure. • Difference between using robust or not, is analogous to continuous data. • xtgee,logit link, corr(exch) • xtgee, logit link, corr(exch), robust
Bottom Line If the scientific focus is on the regression coefficients β: • Focus on modeling the mean structure • Use a reasonable approximation of the covariance structure • Check the inferences for β by comparing β’s robust standard errors with respect to different covariance assumptions • If the β’s standard errors differ substantially, a more careful treatment of the covariance model might be necessary.
Example: 2x2 crossover trial Data from the 2x2 crossover trial on cerebrovascular deficiency adapted from Jones and Kenward, where treatment A and B are active drug and placebo, respectively: the outcome indicates whether an electrocardiogram was judged abnormal (0) or normal (1).
Example: 2x2 crossover trial (cont’d) Goal: To compare the effect of an active drug (A) and a placebo (B) on cerebrovascular deficiency • 34 patients received A followed by B • 33 patients received B followed by A • Yij = 1 if normal electrocardiogram reading At period 1:
Example: 2x2 crossover trial (cont’d) Calculate MLE of odds ratios separately for period 1 and period 2. Odds ratio of being normal for the active drug versus the placebo is: This estimate is larger than 1, and therefore indicates that the active drug produces a higher proportion of normal readings. However, the estimate is not statistically significant. Should we compare (???) the data for Periods 1 and 2?
Example: 2x2 crossover trial (cont’d) This approach has several limitations: • Ignore the carry-over effect, i.e. the effect of the treatment at period 1 might influence the response at period 2 (treatment x period interaction) • Two responses for the same subject are likely to be correlated • In fact, the odds ratio • is estimated to be So, let’s use GEE to estimate a population average odds ratio, taking into account within-subject correlation
Example: 2x2 crossover trial (cont’d) GEE Approach • We combine data from both periods. • We can analyze a 2x2 crossover trial as a longitudinal study with ni = n = 2 and m = 67.
Example: 2x2 crossover trial (cont’d) GEE Approach (cont’d) • Fit a logistic regression model:
exp(0.57)-1 = 0.77 Population average odds of a normal reading are estimated to be 77% higher when using the drugs as compared to the placebo exp(3.56) = 35 Subjects with normal responses at the first visit have odds of normal reading at the next visit that are almost 35 times higher than those whose first response was abnormal
In summary • Model 1 includes the treatment x period interaction (little support from the data), and estimates marginal odds ratio by GEE • Model 2 drops the period x treatment interaction and estimates the marginal odds ratio by GEE • Model 3 assumes that the marginal odds ratio is 1, here = 0.56, with standard error 0.38 (much larger than under Models 1 and 2) • Note: If we fit Model 3, but using robust standard errors, then we obtain similar results to the GEE approach.
The prevalance of respiratory infections in six consecutive quarters reveals a positive seasonal trend with a summer maximum • The prevalence of xerophthalmia also indicates some seasonality with a winter maximum
Example: Respiratory Infections • 275 children in Indonesia were examined for up to six consecutive quarters for the presence of respiratory infections (i=1,…,m=275; j=1,…,6 visits). • Goals of the analysis • Determine whether prevalence of respiratory infection is higher among children who suffer from xerophthlamia (an ocular manifestation of chronic vitamin A deficiency)? • Estimate the change of respiratory infection with age. • Consider seasonality as a potential confounder.
Cross-Sectional Analysis • Model 1: First visit only • Look only at the data from the first visit • Fit a logistic regression model of respiratory infection on xerophthalmia and age, adjusting for other covariates • We find a strong non-linear cross-sectional age effect on the prevalence of respiratory infection • Cross-sectional analysis suggests that the prevalence of respiratory infection increases from age 12 months and reaches its peak at age 20 months before starting to decline
Cross-Sectional Analysis • Model 2: All visits + controlling for seasonality • Look at data from all visits • Fit a logistic regression model of respiratory infection on xerophthalmia and age, adjust for other covariates • We still find a strong non-linear cross-sectional age effect on prevalence of respiratory infection • The age coefficient in Model 2 can be interpreted as weighted averages of the cross-sectional age coefficients for each visit.
Longitudinal Analysis Here we want to distinguish the contributions of cross-sectional and longitudinal information to the estimated relationship of respiratory infection and age.
Longitudinal Analysis • Model 3: Separate CS from LDA • Separate differences among sub-populations of children at different ages and a fixed time (CS)from changes in children over time (LD)
Longitudinal Analysis Model 3: Separate CS from LDA
Longitudinal Analysis Model 4: Separates CS from LDA + controlling for seasonality