Download

1 / 9
100 likes | 450 Views
© Victoria Smith. Stem and Leaf Diagrams. Begin. © Victoria Smith. What is a Stem and Leaf Diagram?. A stem and leaf diagram is a way of organising data. Once it is organised, it is easier to read and work out things like averages. Let’s start with a range of data.

E N D
© Victoria Smith Stem and Leaf Diagrams Begin
© Victoria Smith What is a Stem and Leaf Diagram? A stem and leaf diagram is a way of organising data. Once it is organised, it is easier to read and work out things like averages. Let’s start with a range of data. A class of 30 students were all asked how much they weigh in kilograms. These were the results: Next
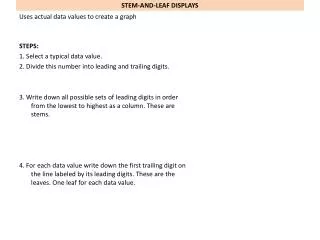
© Victoria Smith Starting the Process First of all, you will need to put the data in numerical order (smallest to largest), as follows: Then you need to draw the table for the information to go in. Draw Table
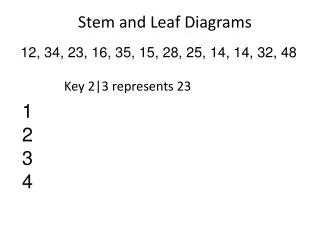
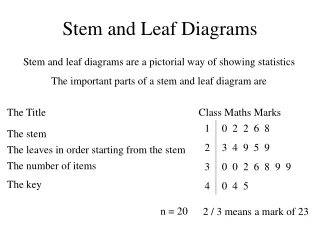
© Victoria Smith Drawing the Table A stem and leaf diagram is made by splitting the bigger parts of the numbers from the smaller parts of the number (in this case, the tens and the units). The bigger parts of the number make up the stem: (The lowest number in our data is 34, so the smallest stem number is 3, the highest in our data is 72, so the largest stem number is 7). Continue
© Victoria Smith Drawing the Table...Continued The smaller parts of our numbers (the units) are used for the leaves in our stem and leaf diagram. Remember they must be written in numerical order. You see how the numbers from our data fit into the stem and leaf diagram. 34 35 35 36 38 39 40 43 45 45 46 47 47 47 50 52 54 56 56 57 58 59 61 62 62 62 63 66 71 72 Key
© Victoria Smith Adding a Key A stem and leaf diagram is not complete without a key. The person reading your diagram will need the key to understand what the numbers represent. In this question, the stem number 3 and the leaf number 4 represent 34. You write the key like this: This is because if you were using a different set of data, for example how much a feather weighs in grams, your answer might be a decimal so the stem would be made up from the whole number and the leaves would be the decimal places: Averages
© Victoria Smith Finding Averages You may be asked in a stem and leaf question to find the mean, mode and median. Let’s start with the mean: To work out the mean, you add all the numbers together and divide by how many numbers you had in total. The total of these numbers is 1538 so 1538 ÷ 30 = 51.26666667. Your answer to 1 decimal place is 51.3, so Mean = 51.3 Median
© Victoria Smith Finding Averages...Continued Next, let’s find the median. The median is the middle number. If there are 30 numbers in total, the middle falls between the 15th number and 16th number (You should know this from learning averages). The 15th number is 50 and the 16th number is 52. To find the middle value between these numbers, simply add them together and divide by 2, so: 50 + 52 = 102 102 ÷ 2 = 51 So the Median = 51 Mode
© Victoria Smith Finding Averages...Continued Lastly, let’s find the mode. The mode is the most common number, the one that appears more times than any other in our set of data. In this case, there are two modes as both the number 47 and the number 62 both occur 3 times, more than any other. If you understood how to draw the stem and leaf diagram but not how to work out the averages, you should revise averages.