Download
1 / 95
970 likes | 1.14k Views
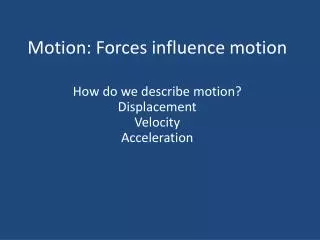
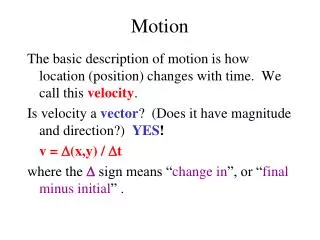
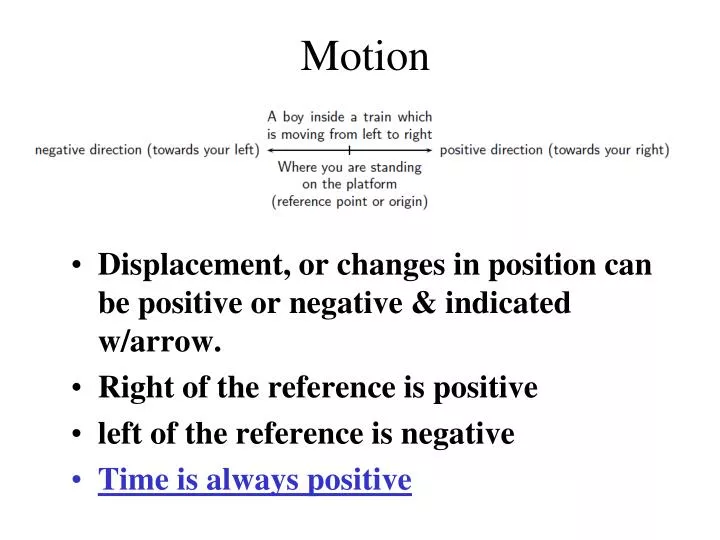
Motion. Displacement, or changes in position can be positive or negative & indicated w/arrow. Right of the reference is positive left of the reference is negative Time is always positive. What is position?.

E N D
Motion • Displacement, or changes in position can be positive or negative & indicated w/arrow. • Right of the reference is positive • left of the reference is negative • Time is always positive
What is position? • The most important idea when studying motion, is you have to know where you are. The word position describes your location (where you are). However, saying that you are here is meaningless, and you have to specify your position relative to a known reference point. • For example, if you are 2 m from the doorway, inside your classroom then your reference point is the doorway. This defines your position inside the classroom. Notice that you need a reference point (the doorway) and a direction (inside) to define your location
Position is a measurement of a location, with reference to an origin.A position is a measurement of a location, with reference to an origin. Positions can therefore be negative or positive. The symbol x is used to indicate position. x has units of length for example cm, m or km. Figure 4 shows the position of a school. Depending on what reference point we choose, we can say that the school is 300m from Joan's house (with Joan's house as the reference point or origin) or 500m from Joel's house (with Joel's house as the reference point or origin). • The shop is also 300m from Joan's house, but in the opposite direction as the school. When we choose a reference point, we have a positive direction and a negative direction. If we choose the direction towards the school as positive, then the direction towards the shop is negative. A negative direction is always opposite to the direction chosen as positive. The origin is at Joan's house and the position of the school is +300 m. Positions towards the left are defined as positive and positions towards the right are defined as negative.
A frame of reference • is defined as a reference point combined with a set of directions. • A frame of reference must have an origin (where you are standing on the platform) and at least a positive direction. • example of frames of reference is a car overtaking another car on a road. Think about sitting in a taxi passing a car. • This is just a matter of perspective (from which reference frame you choose to view the situation). • The car being passed, passenger in taxi vs. pedestrian.
Never connect the dots if the points do not form a smooth line, • draw the best smooth curve possible. • App. The same # above & below the line.
Interpolation- reading from the graph between data points • Extrapolation- reading the graph beyond the limits
Use + and – to indicate the position in relationship to the reference point. • We can use – points!
Sketch position-time graphs for these four motions:a. starting at a positive position with a positive velocityb. starting at a negative position with a smallerpositive velocityc. remaining at a negative positiond starting at a positive position with anegative velocity
. 1st 5 sec- increase next 5 s- runs at a a constant 8 m/s last 3 sec. - slows to a stop How would you describe the motion of the runner shown in the graph. The vertical value of any point is the instantaneous velocity at that time
Draw a position-time graph of a moving elevator. Use the first floor as reference point and up as positive. The elevator waits on the 1st floor for 30 s, rises to the third floor in 20s, where it stops for 30 s, before going to the basement, which it reaches in 40 s.
Instantaneous position • Position at the moment • Moving objects have a series of instantaneous Positions.
Time interval • t = t 2 - t 1 • The triangle (delta) stands for change & is used in many measurements
Independent- X • Y • Dependent
- Linear - straight line y = mx + b m & b are constants Dependent variable varies directly w/independent
If y varies inversely with x- Hyberbola xy= k Boyle’s law- When the Pressure of a gas is doubled, the volume will be reduced to 1/2 its original volume
Y varies directly w/square of x; • Parabola • y = kx2
Slope • The displacement is the vertical separation Rise • the time is the horizontal separation - Run • The ratio of the rise to the run • use the largest possible rise & run for more accuracy
Backing up- the acceleration is negative. • When it comes to a stop the final velocity will be less negative than the initial velocity. • The acceleration will be positive even though the car is moving slower.
Position- time graphs indicate velocity • velocity-time graphs indicate acceleration
Uniform or constant Acceleration • Does not change • velocity-time graph = straight line • initial velocity- when the clock reading is zero
Position-Time graph • Shows how position depends on clock reading or time • time is the independent variable • position is dependent variable • straight line used (best)
Acceleration- zero • Motion at constant speed
Motion at constant speed • Acceleration- zero
A position-time graph for uniformly accelerating motionparabola- varies directly w/square
Instantaneous Velocity • May use a position-time graph to determine • the slope at different times. • Is the tangent to a curve on a position-time graph
Velocity-Time Graphs • Describes motion with either constant or changing velocity • Model the motion with your hand • the displacement between 2 times is the area under the curve of a velocity-time graph
Velocity-time graphfor an airplane moving w/a constant velocity of 260 m/sVelocity is constant • The position-time graph
Constant velocity • The time interval is the same at all time intervals • called uniform velocity • the ratio of d/ t is constant • uniform velocity= • v = d t
average velocity • The slope is the average velocity • V= d/t • slope = rise = d run t
car Shifting w/four gears
Slope (acceleration) is greatest just as the car begins accelerating from rest. • The acceleration is smallest when the velocity is largest.
Constant acceleration • The straight line “curve” on a velocity-time graph indicates that the change in velocity is the same in each time interval • The slope (acceleration) is constant • The airplane acceleration = 20 m/s/s/. • Velocity inc. 20 m/s for every second
Finding the Avg acceleration of a runner during a 100 m dash.
The slope at any point on a position-time graph = the velocity of the object
The slope of a position-time graph is the velocity of the object • W/constant velocity/constant slope -straight linew/acceleration-parabola
The slope of a position-time graphw/acceleration -parabola • to find the slope of the curve at a given point draw a line tangent to the curve at that point • the slope of the tangent line is the instantaneous velocity
Consider the velocity-time graph for an object w/constant acceleration . The shaded area represents displacement Displacement When Velocity & Time Are Known
Area under curve of velocity-time graph=displacement (uniform acc) • Shaded area between ti = 0 & t. • Made up of rectangle w/triangle on top • area of rectangle = height • vi x base (t) • area + vit • w/constant velocity