Download
1 / 23
240 likes | 358 Views
Data requirement for empirical climate prediction models. By Omar Baddour. Outlines. Introduction Major problems with data Various predictands and predictors used in climate prediction Derived data Putting things together into a real world for model development.

E N D
Data requirement for empirical climate prediction models By Omar Baddour
Outlines • Introduction • Major problems with data • Various predictands and predictors used in climate prediction • Derived data • Putting things together into a real world for model development
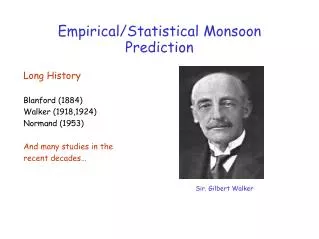
The Southern Oscillation (SO) was first discovered in 1880-1930 • Seasonal anomalies in the tropical atmosphere were connected • Elnino-Southern Oscillation (ENSO)phenomena as a main driving force in many of the observed climate anomalies • The 1984-1994 TOGA experiment in the Pacific Ocean is the one ever conducted to study Ocean/Atmosphere Interaction . • Since then climatic data becomes a great concern within climate research community which led to data quality check and data base organization systems • This has encouraged many International, regional and national institutions to embarque into climate prediction : UKMO, NCEP, ECMWF,ACMAD,DMC ’s….NMHS ’s..
Sampling problem • Data at hand are limited in time and space • Sample versus real world Statistical significance testLikelihood of statistical results • There is various tests for various type of statistical results • Statistical packages offer testing procedures
Missing values problem • Quality of the data is crucial because t quality of statistical results depends also upon it. • Statistician also developed various methods to overcome missing values problem. • Some of the methods used for data recovery : Correlation matrix, Principal Component Analysis, Multiple linear regression.
Outliers problem • Some values in the data set could be largely out of the general behavior (variation) of the data set • These could be natural or artificial • Many statistical packages integrate modules and graphics to indicate these outliers. • A method used to minimize the effect of the outliers is a log transformation of the variable.
Predictands and predictors • Predictands Y’s: Set of what we would like to predict called • PredictorsX’s : Set of What we would like to use as input parameters for prediction called or explicative variables Empirical methods for climate prediction try to associate two sets of climate variables through statistical analysis of their historical time series
Main Predictands • Rainfall and temperaturethe most used ones so far various application: agriculture, flood protection,energy... • Runoff useful for direct application for water resource management • DiseasesHealth application, difficulty in getting good data • Crop index crop yield prediction, empirical model developpment at ACMAD for Nigeria and Cote d’ivoire , good skill
Some other predictands • Rain onset date: Still under prospection, Work of ACMAD in West Africa (Prof. J.B.Omotosho) not yet verified • Hurricane occurrence: Operational forecast in Australia based on SOI and SST
Sea Surface Temperature • 1970’s available on grid box, • 1982 include Satellite SST estimates • Now SST data available on quasi real time through INTERNET : UKMO, NCEPS, ECMWF, etc…. • Global Format : 2.5°x2.5° , 10°x10°, 5 days and monthly • Indices Format: Exemple NINO3 index, TEA (Tropical East Atlantic Index)
Oscillation indices • Southern Oscillation Index SOI= Standardized SLP Tahiti - Standardized SLP Darwin
Oscillation indices - SOI (contd) • Timeseries of SOI are updated routinely each month at various climate centers: NCEPS, BOM Australia • There is some difference in SOI units due to different formula used at each center
Oscillation indices cnd • Northern Atlantic Oscillation index, NAOI: • This index is an atmospheric index computed in similar way as SOI. The pressure stations used are Akurery in Iceland and Punta delGada in Azores. This index characterizes the northern Atlantic pressure oscillation between Azores high pressure and Island low pressure. • Investigation have been conducted in northern Africa (Morocco) to see a predictability potential in this index, unfortunately it does not have similar persistence as SOI. • There is more than one formula for computing NAOI, Be carrefull in mixing from different sources!!!
Oscillation indices cnd • Quasi-Biennial Oscillation (QBO) • It is an index which characterizes the quasi biennial oscillation observed in the wind field at high altitude between 30 and 50 mb,. • The index is being computed using standardized winds over singapore at 30 and 50 mb. Timeserie start in 1979 • A new QBO index has been put in by NCEP which is the zonal wind average over the equator at 30 and 50 mb . • The QBO indices are available routinely within NCEPS web site (CPC)
Derived Data • Time series for individual stations contain a lot of variability that is either local (i.e ; not connected to large scale climate) or attributable to errors in instrumentation averaging the percent of normal or the standardized anomalies generally gives an accurate indication of climate variability over a larger zone • One of these operations leads to an area average anomaly index such as: K is number of stations in the area The obtained index could be therefore used as Predictand for that area
Derived data -cnd • Empirical Orthogonal Function (EOF) technique could be used to reduce the large amount of global SST data without loosing much information. • EOF technique provide time series for leading modes . These time series could be used as predictors
Derived data -cnd SST Patterns using EOF Technique
Putting things together for real world application • Data base requirement • Long enough period (30 to 40 years history) of the data set to ensure statistically significant analysis. • Many hypothesis in statistics are drawn from hypothesized parametric distributions. Make sure the hypothesis are acceptably respected . • Existence of sound physical hypothesis about the connection between Predictands and Predictors. This could be investigated by GCMs or through statistical analysis of dynamical fields such us winds.
Putting things together for real world application -cnd • Data base requirement-cnd • Data base setup including rainfall data set and SST data • Preliminary Predictor selection for the domain of interest (country level for example) • Analysis should be performed to seek for the area of predictors in the Ocean, • Choice of the Season : Some seasons are more predictable than others, predictability, example in Africa: In Sahel area June responds positively to ENSO Forcing while July and August Respond negatively. • Correlation based on individual months could isolate a coherent season and predictability window.
Putting things together for real world application - cnd • Hardware requirement: • Pentium II and preferably III (133 Mhz and more) • Hard disk capacity ( 2 GB) • Software requirement • A statistical package: ex: SYSTAT is one that have been successfully tested in Africa and Latine America, • Graphic Software for mapping such as: Surfer and /or Grads