Download
1 / 11
110 likes | 201 Views
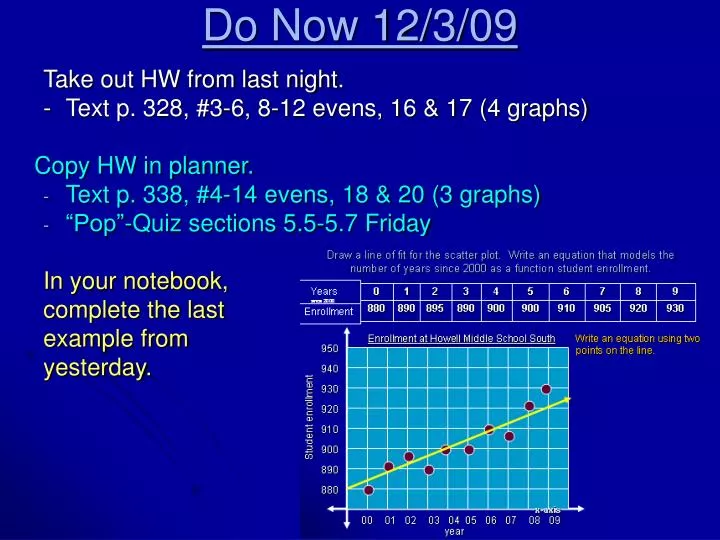
Do Now 12/3/09. Take out HW from last night. - Text p. 328, #3-6, 8-12 evens, 16 & 17 (4 graphs) Copy HW in planner. Text p. 338, #4-14 evens, 18 & 20 (3 graphs) “Pop”-Quiz sections 5.5-5.7 Friday In your notebook, complete the last example from yesterday.

E N D
Do Now 12/3/09 Take out HW from last night. - Text p. 328, #3-6, 8-12 evens, 16 & 17 (4 graphs) Copy HW in planner. • Text p. 338, #4-14 evens, 18 & 20 (3 graphs) • “Pop”-Quiz sections 5.5-5.7 Friday In your notebook, complete the last example from yesterday.
Draw a line of fit for the scatter plot. Write an equation that models the number of years since 2000 as a function student enrollment. Years since 2000 Enrollment Enrollment at Howell Middle School South Write an equation using two points on the line. 950 940 Use the points (4, 900) and (6, 910). 930 910 – 900 = _10_ = 5 6 – 4 2 920 Student enrollment 910 Find the y-intercept. Use (4, 900). 900 y = mx + b 900 = 5(4) + b b = 880 890 880 x-axis y = 5x + 880 00 01 02 03 04 05 06 07 08 09 year
3) positive correlation 4) relatively no correlation 5) negative correlation 6) y = 11.5x – 0.28 8) C 10) The independent variable is always x not y. y decreases as x increases. 12) Relatively no correlation. No, because there is relatively no correlation you can not write an equation. Homework Text p. 328, #3-6, 8-12 evens, 16 & 17
16) a). b). Positive correlation; the larger the home range size the larger the percent of pacing time. c). No; it is below the expected percent of time spent pacing. Homework Text p. 328, #3-6, 8-12 evens, 16 & 17 • 17) a). b). Sample answer; y = -2.2x + 111 c). The slope of your line. -2.2 degrees per kilometer
Objective • SWBAT make predictions using best-fitting lines • SWBAT find the zero of a function
Section 5.7 “Predict with Linear Models” Best-Fitting Line line that most closely follows the trend of the data. y x Linear Regression the process of finding the best- fitting line to model a set of data using technology.
Linear Interpolation Using a line or its equation to approximate a value BETWEEN two known values. Predict the height of the tree @ 3 ½ years. 4 Find the equation of the best-fitting line. Use the points (1, 1) and (5, 4). 3 height of tree 1 – 4 = _-3_ = 3/4 1 – 5 -4 2 1 Find the y-intercept. Use (1, 1). y = mx + b 1 = 3/4(1) + b b = 1/4 0 1 2 3 4 5 6 7 years y = 3/4x + 1/4 Plug in 3.5 years for x. At 3 ½ years the height of the tree would be approximately 2.875 feet tall. y = ¾(3.5) + 1/4 y = 2 7/8 feet
Linear Extrapolation Using a line or its equation to approximate a value OUTSIDE the range of known values. Predict the height of the tree @ 6 years. 4 Find the equation of the best-fitting line. 3 Use the points (1, 1) and (5, 4). height of tree 1 – 4 = _-3_ = 3/4 1 – 5 -4 2 1 Find the y-intercept. Use (1, 1). y = mx + b 1 = 3/4(1) + b b = 1/4 0 1 2 3 4 5 6 7 years y = 3/4x + 1/4 Plug in 6 years for x. At 6 years the height of the tree would be approximately 4 ¾ feet tall. y = ¾(6) + 1/4 y = 4 ¾
Zero of a Function A zero of a function is an x-value for which f(x) = 0. Because f(x) is the same as y, and y = 0 along the x-axis of the coordinate plane, a zero of a function is an x-intercept of the function’s graph. Find the zero of the functions. f(x) = 3x – 15 f(x) = ½x + 4 f(x) = -0.5x + 0.75 0 = 3x – 15 0 = ½x + 4 0 = -0.5x + 0.75 -4 = -4 -0.75 = -0.75 +15 = +15 15 = 3x (2)(-4) = ½x (2) -0.75 = -0.5x 3 = 3 -0.5 = -0.5 5 = x -8 = x 1.5 = x The zero of f(x) = 3x -15 is 5. The zero of f(x) = 1/2x + 4 is -8. The zero of f(x) = -0.5x + 0.75 is 1.5.
Graphing Calculator Activity“Perform Linear Regression” Linear regression- the process of finding the best fitting line to model a set of data. Using a graphing calculator, read and complete examples 1 & 2 in the text on page 332 & 333. Then complete the PRACTICE problems #1-5. Write your answers on a new page in your notebook. Refer to page 325 for assistance.
Homework Text p. 338, #4-14 evens, 18 & 20 (3 graphs)