Download
1 / 24
1.57k likes | 3.3k Views
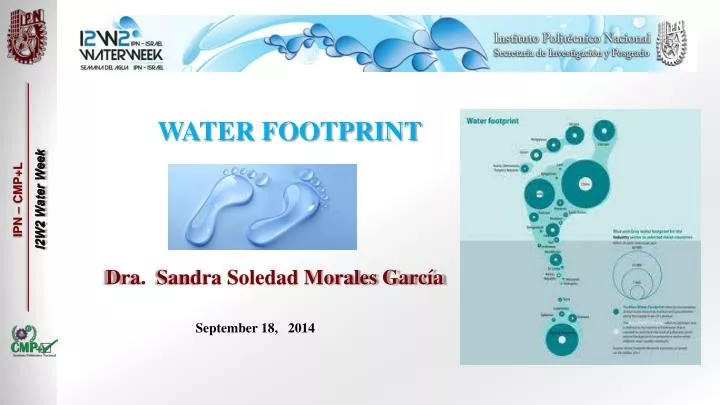
WATER FOOTPRINT. IPN – CMP+L I2W2 Water Week. Dra. Sandra Soledad Morales García. September 18, 2014. Human activities consume and pollute a lot of water.

E N D
WATER FOOTPRINT IPN – CMP+LI2W2 WaterWeek Dra. Sandra Soledad Morales García September 18, 2014
Human activities consume and pollute a lot of water. At a global scale, most of the water use occurs in agricultural production, but there are also substantial water volumes consumed and polluted in the industrial and domestic sectors (WWAP, 2009). Water consumption and pollution can be associated with specific activities, such as irrigation, bathing, washing, cleaning, cooling and processing. Total water consumption and pollution are generally regarded as the sum of a multitude of independent water demanding and polluting activities. IPN – CMP+LI2W2 WaterWeek
The footprint concept involves measuring the total amount of environmental impacts produced direct or indirect per products or processes at all stages of their life cycle environment produced. So if we have an emissions inventory can be calculated: Ecological Footprint (Rees, 1992) Carbon Footprint (PAS 2050: 2011, ISO / CD14067, 2011) Footprint Toxicology (Hauschild et al., 2011) Water footprint (Hoekstra et al, 2011;. ISO / DIS 14046) Once you know the size, it is possible to implement a strategy to reduce it. IPN – CMP+LI2W2 WaterWeek
The concept of water footprint is based on life-cycle thinking, which means accounting for the entire value chain of the product. The inventory includes water input and output data for volume, source, and water quality throughout the life cycle. The potential impact of water use is evaluated by water scarcity indices or with wider impact assessment methods. To calculate the water footprint, the technique of life cycle analysis (LCA) is used, which applications to date have allowed a full comparison of the environmental impacts of products and services problems at every stage of their life cycle . IPN – CMP+LI2W2 WaterWeek
A simplified flowchart showing how water is related to life cycle impact assessment (LCIA). LCA assesses the potential environmental impacts throughout the life cycle of a product or service from the extraction of raw materials, through production, use, final treatment and recycling, to disposal. IPN – CMP+LI2W2 WaterWeek
J. A. Allan (Allan, 1998) introduces the virtual water concept, which states that each product, besides water which incorporates requires a greater volume of water in their production process. The virtual water concept was revived in 2002 by Arjen Y. Hoekstra and Ashok Chapagain and applied to a new concept: the water footprint (Hoekstra, 2003: Hoekstra and Chapagain, 2004). The methodology proposed by Hoekstra, publicized the initiative Water Footprint Network (WFN), was created to obtain an indicator that linked the water with the consumption of the population. IPN – CMP+LI2W2 WaterWeek
Definition of Water Footprint Footprint, from its origin, involves measuring total environmental impacts. The total water volume isn´t sufficient to evaluate a footprint, it´s necesary transform these environmental impacts in order that it can be reported as Water Footprint (ISO / DIS 14046, 2011), and is defined as: "... The total amount of water produced by impact processes, products or services at all stages of their life cycle." IPN – CMP+LI2W2 WaterWeek
The approach developed in the ISO standarisation work is based on examination of environmental and human health impacts, with consideration for regional water stress, water volume, and water quality. The ISO approach stresses that water footprint is an impact, not a volume or an inventory. As the water footprint is a local indicator, regional water scarcity or water stress should be determined. Changes in both water volume and water quality can lead to local water stress, which should be assessed, estimated, or measured. IPN – CMP+LI2W2 WaterWeek
There are four phases required for an LCA study according to the NMX-14044-SAA-IMNC-2008 "Environmental Analysis Management-Lifecycle-Requirements and Guidelines" which meets the mandatory requirements of ISO 14044: • Defining the objective and scope of the LCA • Analysis of the life cycle inventory (LCI) • Impact assessment of the life cycle (LCIA) • - Interpretation of the life cycle. IPN – CMP+LI2W2 WaterWeek
The volumes of water used in the different stages of the life cycle of a product or process are describe in the step of inventory For each category of impact, LCIA applied characterization factors specific to each substance, representing the power of the same: IPN – CMP+LI2W2 WaterWeek
The water footprint is an indicator of freshwater use that looks not only at direct water use of a consumer or producer, but also at the indirect water use. The water footprintit is a multidimensional indicator: The blue water footprint refers to consumption of blue water resources (surface and groundwater) along the supply chain of a product. IPN – CMP+LI2W2 WaterWeek
The green water footprint refers to consumption of green water resources (rainwater insofar as it does not become run-off). The grey water footprint refers to pollution and is defined as the volume of freshwater that is required to assimilate the load of pollutants given natural background concentrations and existing ambient water qualitystandards. As an indicator of ‘water use’, the water footprint differs from the classical measure of ‘water withdrawal’ in three respects next Figure : IPN – CMP+LI2W2 WaterWeek
Schematicrepresentation of the componentes of a waterfootprint IPN – CMP+LI2W2 WaterWeek
Water footprint assessment’ refers to the full range of activities to: (i) identify and locate the water footprint of a process, product, producer or consumer or to quantify in space and time the water footprint in a specified geographic area; (ii) assess the environmental, social and economic sustainability of this water footprint; and (iii) formulate a response strategy. Broadly speaking, the goal of assessing water footprints is to analyse how human activities or specific products relate to issues of water scarcity and pollution, and to see how activities and products can become more sustainable from a water perspective. IPN – CMP+LI2W2 WaterWeek
People use lots of water for drinking, cooking and washing, but even more for producing things such as food, paper, cotton clothes, etc. IPN – CMP+LI2W2 WaterWeek
Some facts The production of one kilogram of beef requires 15 thousand litres of water (93% green, 4% blue, 3% grey water footprint). The water footprint of a 150-gram soy burger produced in the Netherlands is about 160 litres. The water footprint of Chinese consumption is about 1070 cubic meter per year per capita. Japan with a footprint of 1380 cubic meter per year per capita, has about 77% of its total water footprint outside the borders of the country. IPN – CMP+LI2W2 WaterWeek
The water footprint of US citizens is 2840 cubic meter per year per capita. About 20% of this water footprint is external. The global water footprint in the period 1996-2005 was 9087 Gm3/yr (74% green, 11% blue, 15% grey). Agricultural production contributes 92% to this total footprint. Water scarcity affects over 2.7 billion people for at least one month each year. IPN – CMP+LI2W2 WaterWeek
Green Footprint IPN – CMP+LI2W2 WaterWeek Blue Footprint GreyFootprint
ReasearchaboutWaterFootprint…. IPN – CMP+LI2W2 WaterWeek
Years of publication…. IPN – CMP+LI2W2 WaterWeek
Degree of pressure, population, average renewable water and water footprint by RHA (National Water Commission) HydrologicalAdministrative Regio IPN – CMP+LI2W2 WaterWeek
Population distribution, availability and average water footprint per capita by RHA Human. IPN – CMP+LI2W2 WaterWeek
Although water can be considered a renewable resource when carefully controlled extraction, use, treatment and disposal, the fact is that the availability of uncontaminated freshwater is declining steadily. In many parts of the world, demand already exceeds supply, and as the world population grows, so does the requirement of this vital. IPN – CMP+LI2W2 WaterWeek


![[ ISO 14046 - Water footprint – potential standard ]](https://cdn1.slideserve.com/1785694/slide1-dt.jpg)