Download
1 / 29
290 likes | 782 Views
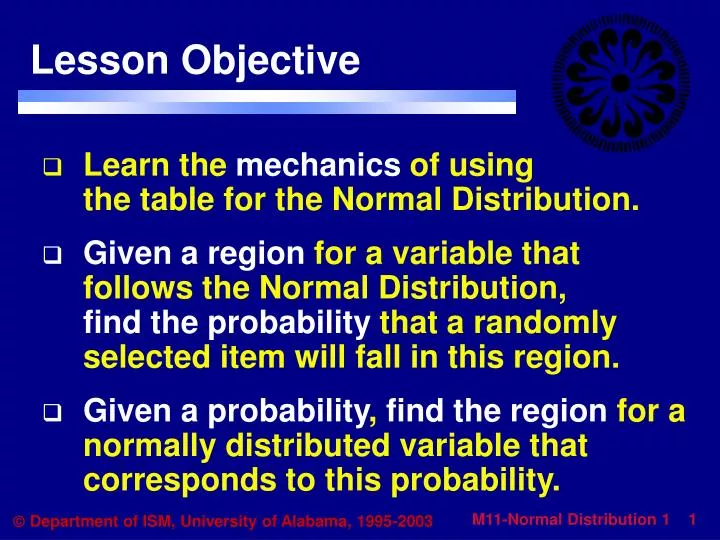
Lesson Objective. Learn the mechanics of using the table for the Normal Distribution. Given a region for a variable that follows the Normal Distribution, find the probability that a randomly selected item will fall in this region.

E N D
Lesson Objective • Learn the mechanics of using the table for the Normal Distribution. • Given a region for a variable that follows the Normal Distribution,find the probability that a randomlyselected item will fall in this region. • Given a probability, find the region for a normally distributed variable that corresponds to this probability.
Describes the shape for some quantitative, continuous random variables. The Normal Distributions a.k.a., “The Bell Shaped Curve”
= mean determines the location. = standard deviation determinesspread, variation, scatter. Normal Population Distribution has two parameters:
X ~ N( m = 66, s = 9) or N(66, 9) Z = the number of standard deviations that an X - value is from the mean. X - m s Z = Notation: Z ~ N( m = 0, s = 1 ) or N(0,1) Z follows the “Standard Normal Distribution”
Empirical Rule of the Normal Distribution ______, ±3s ______, ±2s Where does thiscome from? ____, ±1s
The “area” under the curve within a range of X values is equal to proportion of the population within that range of X values. Question: How do we compute “areas”? • Geometry formulas • Calculus (integration) • Tables • Excel • Minitab Recall
Step 1 for all problems: Reading the Standard Normal Table (finding areas under the normal curve) DTDP
Standard Normal Table 2nd decimal place Table gives P(0 < z < ?) = FindP(0 < z < 1.72) = .4573 Up to the 1st decimal place 1.72 0
What proportion of Z values are between –1.23 and +2.05? P(-1.23 < Z < 2.05) = ? = = -1.23 0 Z 2.05 What proportion of Z values are between +1.23 and +2.05? ? P(1.23 < Z < 2.05) = ? = = 2.05 0 Z 1.23
Weights of packages are normally distributed with mean of 10 lbs. and standard deviation of 4.0 lbs. Find the proportion of packages that weigh between 10 and 15.72 lbs. P( 10.0 < X < 15.72) =? X = weight of packages. X ~ N(m = 10, s = 4.0) 10 X 15.72 Z 15.72 – 10.0 4.0 = Z = P( 0 < Z < 1.43) 10.0 – 10.0 4.0 = Z = =
Same situation. What proportion of packages weigh more than 15.72 lbs? P( X > 15.72) =? ? X = weight of packages. X ~ N(m = 10, s = 4.0) 10 X 15.72 0 Z 1.43 15.72 – 10.0 4.0 = 1.43 Z = P( Z > 1.43) = =
.5000 Same situation. What proportion of packages weigh less than 14.2 lbs? P( X < 14.2) =? .3531 X = weight of packages. X ~ N(m = 10, s = 4.0) 10 X 14.2 0 Z 1.05 14.2 – 10.0 4.0 = 1.05 Z = P( Z < 1.05) = .5 + .3531 =.8531
Same situation. What proportion of packages weigh between 5.08 and 18.2 lbs? X = weight of packages. X ~ N(m = 10, s = 4.0)
Same situation. What proportion of packages weigh either less than 2.4 lbs or greater than 11.0 lbs? Homework X = weight of packages. X ~ N(m = 10, s = 4.0)
This is a backwards problem! We are given the probability;we need to find the boundary. ? – 10 4 –1.28 = Same situation. Find the weight such that 10% of all packages weigh less than this weight. P( X < ?) =.10 .40 .10 10 X ? 0 Z -1.28 X = weight of packages. X ~ N(m = 10, s = 4.0) ?= 10 – 1.28 • 4 = 10 – 5.12 = 4.88 pounds P( Z < ) -1.28 = .10 10% weigh less than 4.88 pounds; 90% weigh more than 4.88 pounds.
0 Standard Normal Table Table gives P(0 < z < ?) = FindP(__< z < 0) =.40 .4000 Find the Z value to cut off the top 10%. -1.28
Standard Normal Table Table gives P(0 < z < ?) = .25 .25 Find the Z values that define the middle 50%. 0 ? ?
Standard Normal Table Table gives P(0 < z < ?) = Find the Z values that define the middle 95%.
NORMDIST – Used to compute areas under any normal curve. Can also compute height of curve (not useful except for drawing normal curves). NORMSDIST - Used to compute areas under a standard normal( N(0,1) or Z curve ). Normal Functions in Excel
NORMINV - Used to find the X value corresponding to a given cumulative probability for any normal distribution. NORMSINV - Used to find the Z value corresponding to a given cumulative probability for a standard normal distribution. Normal Functions in Excel
Practice problems. 1. P( Z < –1.92) = You MUST know how to work ALL of these problems and the followingpractice problemsto pass this course. 2. P( Z < 2.56) = 3. P( Z > 0.80) = 4. P( Z = 1.42) = 5. P( .32 < Z < 2.48) = 6. P( -1.75 < Z < 1.75) = • 7. P( Z < 4.25) = • P( Z > 4.25) = • P(-.05 < Z < .05) = • Find Z such that only 12% are smaller.
Practice problem answers • .0274 • .9948 • 1.0 – .7881 = .2119 • .0 • .9934 – .6255 = .0689 • .9599 – .0401 = .9198 • 1.0000 • .0000 • .0398 • -1.175
X – Z = Question: What do we do when we have a normal population distribution, but the mean is not “0” and/or the standard deviation is not “1”? Use the Universal Translator Example: Suppose X ~ N(120, 10).11. Find P ( X > 150 ). 12. Find the quartiles of this distribution.
ori What proportion of Z values are between 0 and 1.43? P( 0 < Z < 1.43) = ? .4236 = .4236 0 Z 1.43 What proportion of Z values are between -1.43 and 0? .4236 P(-1.43 < Z < 0) = ? = .4236 0 Z -1.43
.5000 What proportion of Z values are greater than 1.43? P(Z > 1.43) = ? .4236 .0764 = .5 - .4236 = .0764 0 Z 1.43 .5000 .4236 What proportion of Z values are less than 1.43? P(Z < 1.43) = ? = .5 + .4236 = .9236 0 Z 1.43
.4798 What proportion of Z values are between –1.23 and 2.05? P(-1.23 < Z < 2.05) = ? .3907 = .4798 + .3907 = .8705 -1.23 0 Z 2.05 .4798 .4236 What proportion of Z values are between 1.23 and 2.05? .0562 P(1.23 < Z < 2.05) = ? = .4798 - .4236 = .0562 2.05 0 Z 1.23
Same situation. Find the proportion of packages that weigh between 4.28 and 10.0 lbs. P( 4.28 < X < 10.0) =? .4236 X = weight of packages. X ~ N(m = 10, s = 4.0) 10 X 4.28 0 Z -1.43 4.28 – 10.0 4.0 = -1.43 Z = = P( -1.43 < Z < 0) 10.0 – 10.0 4.0 = 0 Z = = .4236
.4750 Same situation. What proportion of the packages weigh between 13.0 and 17.84 lbs? .2734 P( 13.0 < X < 17.84) =? ? X = weight of packages. X ~ N(m = 10, s = 4.0) 10 13 X 17.84 0 .75 Z 1.96 17.84 – 10.0 4.0 = 1.96 Z = = P( .75 < Z < 1.96) 13.0 – 10.0 4.0 = .75 Z = = .4750 - .2734 =.2016
Same situation. • Find the weight such that a. 16% weigh more less than this value. • b. You have the boundaries of the middle 80%. • c. The top 25% weigh more. • You have the quartiles. X Z X = weight of packages. X ~ N(m = 10, s = 4.0)