Download
1 / 2
20 likes | 120 Views
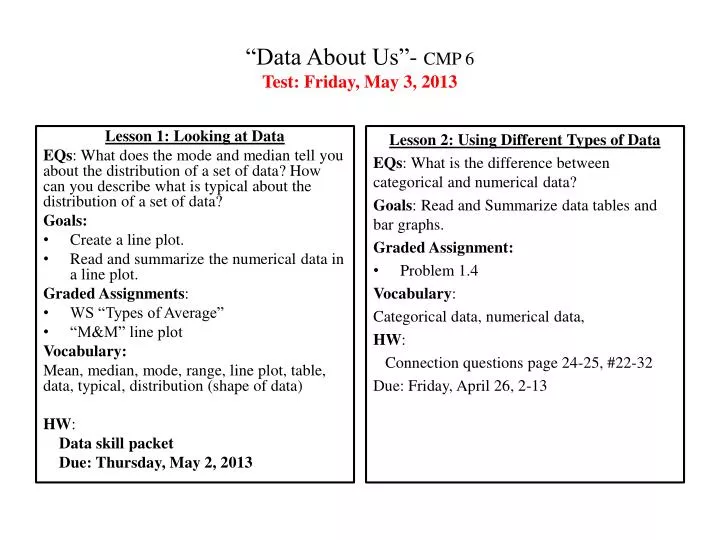
“Data About Us ”- CMP 6 Test: Friday, May 3, 2013. Lesson 1 : Looking at Data EQs : What does the mode and median tell you about the distribution of a set of data? How can you describe what is typical about the distribution of a set of data ? Goals: Create a line plot.

E N D
“Data About Us”- CMP 6Test: Friday, May 3, 2013 Lesson 1: Looking at Data EQs: What does the mode and median tell you about the distribution of a set of data? How can you describe what is typical about the distribution of a set of data? Goals: • Create a line plot. • Read and summarize the numerical data in a line plot. Graded Assignments: • WS “Types of Average” • “M&M” line plot Vocabulary: Mean, median, mode, range, line plot, table, data, typical, distribution (shape of data) HW: Data skill packet Due: Thursday, May 2, 2013 Lesson 2: Using Different Types of Data EQs: What is the difference between categorical and numerical data? Goals: Read and Summarize data tables and bar graphs. Graded Assignment: • Problem 1.4 Vocabulary: Categorical data, numerical data, HW: Connection questions page 24-25, #22-32 Due: Friday, April 26, 2-13
Lesson 3: Using Graphs to Explore Data EQs: How do you locate the median and range using a stem plot? When you make a coordinate graph of data pairs, how do you determine where to place each point? What do you need to consider when choosing a scale for each axis of a coordinate graph? How do you decide when to use a stem plot, bar graph, line plot, or coordinate graph? Goals: • Display numerical data in a stem-and-leaf plot and coordinate graph. • Read a coordinate graph and stem plot. • Persevere through the mathematics. Vocabulary: Stem plot, coordinate graph, interval, scale, Graded Assignments: • “Additional Practice” packet • Quiz – Friday, April 26, 2013 Lesson 4: Histograms & Box Plots EQs: Does a data distribution have a definite center? If you measure the center in different ways, will it always have the same value? How can interquartile range and mean absolute deviation be useful for summarizing data? Goals: • Display numerical data in histograms and box plots. • Summarize numerical data by giving measures of center and variability and describing overall patterns. Vocabulary: IQR, MAD, histogram, box plot, variability, lower quartile, upper quartile, Graded Assignments: • “Additional Practice” WS HW: “Check-Up” – Investigation 5 (WS) TEST FRIDAY MAY 3, 2013