Download
1 / 73
740 likes | 1.05k Views
Osmosis in Potatoes. IB Biology Topic 2 Internal Assessment. Now your turn!!. Lesson 1: -pre-lab -carrying out a standardised practical using handouts I will give you

E N D
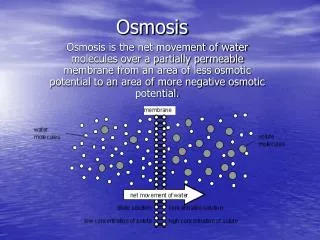
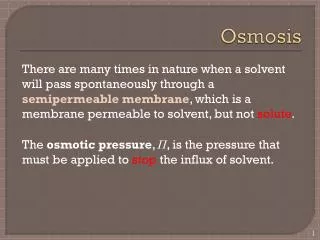
Osmosis in Potatoes IB Biology Topic 2 Internal Assessment
Now your turn!! • Lesson 1: -pre-lab -carrying out a standardised practical using handouts I will give you -familiarising yourself with working in a lab and thinking about how you could adapt the experiment for an Internal Assessment • Lesson 2: -Using your Design Lab Training Sheet you will work in teams to design a practical investigating an aspect of osmosis. • Lesson 3: -You will carry out the practical and collect data as a team. • Lesson 4 + 5: -I will show you how to process your data with statistics! -specifically using Excel to calculate means, standard deviations and draw graphs • Lesson 6: -I will guide you on how to write a conclusion and evaluation • Lesson 7: -Your practical will be handed in -written up individually and in the correct format -self assessment should be complete as well
Pre-lab 3 cm 3 cm
Writing A Statement of the Problem for the Experiment What should it state? It should state: “The Effect of the IndependentVariable on the DependentVariable”. A good statement of the problem for “Rate of photosynthesis” would be The effect of light intensity on the rate of photosynthesis
More about our variables: The independent variable is the variable that is purposely changed. It is the manipulated variable. The dependent variable changes in response to the independent variable. It is the responding variable. What is the “photosynthesis” independent variable? Light intensity measured in Lux What is the dependent variable? Volume of O2 produced per minute
Title for the photosynthesis experiment The effect of light intensity on the rate of photosynthesis of Elodea
Another Look at Our Hypothesis INDEPENDENT VARIABLE If the light intensity increases, DEPENDENT VARIABLE then the rate of photosynthesis will increase. To make this IB worthy you MUST: a)Include a sketch graph of your predicted results b) Give SCIENTIFIC reasoning as to why you predict this
Controls in an Experiment Factors that are kept the same and not allowed to change What should be kept constant in the experiment? CONSTANTS Type of plant C02 concentration Time the experiment runs for Time intervals at which the DV is measured Wattage of light bulb Colour of bulb Temperature of experiment Time of day
Values of the Independent Variable How many different values of the independent variable should we test? Enough to clearly illustrate a trend in the data –always use the 5x5 rule for continuous data e.g. 10cm, 20cm, 30cm, 40cm, 50cm
Repeated Trials How many repeated trials are needed in the experiment At least 5, then calculate n mean value for each level of the independent variable (this will also give enough data to calculate standard deviation)
Carrying out your practical… Qualitative Observations (must have these or zero for DCP1!!) • It seemed as it the rate of oxygen production started slowly at first but then speeded up • The bubbles of oxygen were all different sizes
Quantitative: Sample Data Table Title:The effect of changing light intensity on the rate of photosynthesis in Elodea Vol of 02 produced in 5 min (±0.01ml) TRIALS Distance of light source (±1cm) Mean Vol of 02 produced in 5 min (±0.01ml) 1 2 3 3.00 5.00 4.00 4.00 4.00 5.00 6. 00 5.00 6. 00 7.00 5.00 6.00 7.00 8.00 6. 00 7.00 9.00 7. 00 8. 00 8.00 10 20 30 40 50
Data Processing • You need to: • Calculate percentage change for EACH trial of EACH molarity of solution –(why % change and not just change in mass?) • Calculate the mean percentage change for EACH molarity of solution –(why % change and not just change in mass?) • Calculate the errorfor EACH mean • Plot a graphcomparing percentage changes
Two classes took a recent quiz. There were 10 students in each classEach class had an average score of 81.5
Since the averages are the same, can we assume that the students in both classes all did pretty much the same on the exam?
The answer is… No.The average (mean) does not tell us anything about the distribution or variation in the grades.
So, we need to come up with some way of measuring not just the average, but also the spread of the distribution of our data.
Why not just give an average and the range of data (the highest and lowest values) to describe the distribution of the data?
Well, for example, lets say from a set of data, the average is 17.95 and the range is 23. But what if the data looked like this:
Here is the average But really, most of the numbers are in this area, and are not evenly distributed throughout the range. And here is the range
The Standard Deviation is a number that measures how far away each number in a set of data is from their mean.
If the Standard Deviation is large, it means the numbers are spread out from their mean.If the Standard Deviation is small, it means the numbers are close to their mean. large, small,
Here are the scores on the biology quiz for Team A: Average: 81.5
The Standard Deviation measures how far away each number in a set of data is from their mean. For example, start with the lowest score, 72. How far away is 72 from the mean of 81.5? 72 - 81.5 = - 9.5 - 9.5
Or, start with the lowest score, 89. How far away is 89 from the mean of 81.5? 89 - 81.5 = 7.5 - 9.5 7.5
Now, lets compare the two classes again 81.5 81.5 4.88 15.91
Conclusion This is the section where you draw conclusions about the experiment as it relates to your aim and hypothesis. Calculated results should be compared to values from the literature (i.e. accepted values from professional laboratories) where possible. This section should include: • Conclusion based on your Aim or Hypothesis. (using appropriate language) • States the quantitative or qualitative relationship • Correctly interprets the graph of the data • Includes relevant calculated values to support conclusion • Includes some elaboration based on the science being learned
Discussion of errors and limitations to the experiment • Must comment on the “quality” of the results, do they make sense? • Identifies anomalous results where appropriate (use your SDs to help you do this!) • Prioritizes errors and suggests where they came from. • Utilizes the ideas of “systematic” and “random” errors in the discussion • Indicate what effect the error(s) would have on the results • Human errors should not be the main source of errors! • Suggestions for improvements • Identifies weaknesses in the experiment and suggests realistic suggestions for improvement • Improvements should help to improve the errors previously identified
How to write an effective conclusion Also known as putting it all together