Download
1 / 40
400 likes | 541 Views
The Tanzania Household Budget Survey (HBS) from 2000/2001, conducted by the National Bureau of Statistics, sheds light on key socio-economic dynamics across the nation. Covering 22,178 households, it explores household education, economic activities, health status, consumption, income, and ownership of consumer goods. This data is crucial for monitoring poverty and guides policies under Tanzania's development vision. Analysis reveals significant trends, including disparities between urban and rural populations and changes in household consumption and amenities. ###

E N D
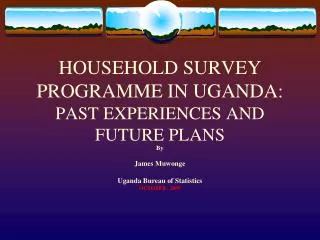
2000/2001 Household Budget Survey (HBS) Conducted by The National Bureau of Statistics
Sample Design • 22,178 Households were covered in 2000/01 • Around 1,000 Households in each region • The Survey provides Regional Estimates • 4,823 Households were covered in 1991/92 • It provides National Estimates • Both surveys provide rural/urban/DSM
Information Collected • Household Members’ Education, Economic Activities and Health Status • Household Expenditure, Consumption and Income • Ownership of Consumer Goods and Assets • Housing Structure and Building Materials, and • Household Access to Services and Facilities
Analysis: General Issues • In framework of poverty monitoring & policy: Tanzania development Vision 2025, National Poverty Eradication Strategy and the PRSP, • Analysis guided by the Research and Analysis TWG and stakeholder consultations • Provides a baseline for the future • Describes trends in 1990s, comparing with HBS 1991/92
RESULTS The Tanzanian Household
Percentage of Households Living in Dwellings Made of Modern Materials
Household Amenities • Fall in Average Distance to Some Key Services (Markets, Public Transport, Shops) • Increase in Ownership of a Number of Consumer Goods • 10% of Hhs are Connected to Electricity National Grid • This Increased in Urban Areas Only
Percentage of Adults with Some Education, by Sex and Area, 2000/01
Percentage of Children Aged 7-13 in School, 1991/92 and 2000/01
There are Many Over Aged Children in Primary School • They are Often Below the Class they Should be in for Their Age • Enrolment in Secondary Education is Low, 5% of 14 – 17 year olds are in Forms 1-IV
Client (User) Satisfaction • Clients reported most dissatisfaction with Govt. Providers • Long waiting times • Lack of Drugs • High Cost of Modern private care • Ineffectiveness of Treatment for Traditional Healers
About 89% of Rural Hhs owned Land for Agriculture or Grazing, As was in 1991/92 • The Degree of Agriculture Mechanisation among Rural Hhs is Low – 11% Own a Plough, only 0.2% have a Tractor
Expenditure Recorded over One Month • The survey recorded everything that the interviewed households consumed over one month • It included food and other items that have been purchased, and food grown by the Hh and consumed during the month • It excluded household expenditure that was not for consumption, e.g., purchasing inputs for a farm worked by the household
Trends in Household Consumption Expenditure per Person • Average Consumption is highest in Dar es Salaam and lowest in Rural Areas (TShs. 21,949 compared to 8,538) • After adjusting for inflation, Hh consumption rose by around 17% • The largest rise was in DSM
Overview of Poverty Analysis Data Non- Cons. Total Exp. House- hold Not Poor Cons. Cons. AE Poverty Line Poor AE = Adult Equivalent
Percentage of the Population below the Basic Needs Poverty Line, 1991/92 and 2000/01
Because of population growth, there was an increase in the number of individuals living in poverty (11.4 mill in 2000/01 compared to 9.5 mill in 1991/92) • A small increase in inequality occurred
Percentage of Poor Individuals, by Education of Household Head, 1991/92 and 2000/01
A Diversity of Sources • The sale of Agricultural products was the main source of Cash Income for 62% of Hhs, compared with 67% in 1991/92 • Food Crops remain the most important single source • The importance of cash crops has fallen. They provide the main cash source for only 17% of Hhs • Agriculture provides slightly over half of total household Income, 60% in rural areas.
Mean Monthly Income per Earner by Gender and Educational Level (‘000 TShs)
Income poverty is high and many social indicators are poor • There are large differences in the indicators between different groups • The largest gap is between urban and rural populations – the rural population is much poorer
Regional differences are more variable; some are consistently disadvantaged e.g Lindi, Singida • Differences between men and women are smaller than the geographical differences • Women have lower incomes than men and less education, but girls have higher primary school enrolment
Many measures of welfare show modest improvements during the 1990s • The economy diversified and household consumption has increased • The proportion who are poor has fallen slightly, although the absolute numbers has risen. • But there have been increases in inequality – particularly between urban and rural areas