Download
1 / 90
1.05k likes | 1.79k Views
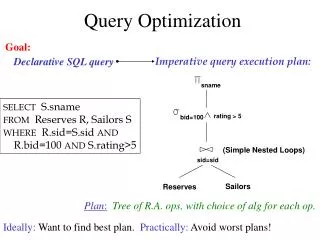
6 . Distributed Query Optimization. Chapter 9 Optimization of Distributed Queries. Outline. Overview of Query Optimization Centralized Query Optimization Ingres System R Distributed Query Optimization. Step 3: Global Query Optimization.

E N D
6. Distributed Query Optimization Chapter 9 Optimization of Distributed Queries
Outline • Overview of Query Optimization • Centralized Query Optimization • Ingres • System R • Distributed Query Optimization
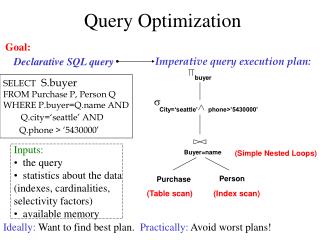
Step 3: Global Query Optimization • The query resulting from decomposition and localization can be executed in many ways by choosing different data transfer paths. • We need an optimizer to choose a strategy close to the optimal one.
Problem of Global Query Optimization Input: Fragment query Find the best (not necessarily optimal) global schedule Minimize a cost function Distributed join processing Bushy vs. linear trees Which relation to ship where? Ship-whole vs. ship-as-needed Decide on the use of semijoins Semijoin saves on communication at the expense of more local processing Join methods Nested loop vs. ordered joins (merge join or hash join)
Cost-based Optimization • Solution space • The set of equivalent algebra expressions (query trees) • Cost function (in terms of time) • I/O cost + CPU cost + communication cost • These might have different weights in different distributed environments (LAN vs. WAN) • Can also maximize throughput • Search algorithm • How do we move inside the solution space? • Exhaustive search, heuristic algorithms (iterative improvement, simulated annealing, genetic, …)
Query Optimization Process input query Search Space Generation Transformation Rules equivalent query execution plan Cost Model Search Strategy best query execution plan
Search Space Search space characterized by alternative execution plans Focus on join trees For N relations, there are O(N!) equivalent join trees that can be obtained by applying community and associativity rules.
Three Join Tree Examples SELECT ENAME, RESP FROMEMP, ASG, PROJ WHERE EMP.ENO = ASG.ENOAND ASG.PNO=PROJ.PNO (a) (b) PNO ENO ENO PROJ PNO EMP EMP ASG PROJ ASG ENO,PNO (c) X ASG PROJ EMP
Restricting the Size of Search Space (c) ENO,PNO X ASG • A large search space • optimization time much more than the actual execution time • Restricting by means of heuristics • Perform unary operations (selection, projection) when accessing base relations • Avoid Cartesian products that are not required by the query • E.g., previous (c) query plan is removed from the search space PROJ EMP
Restricting the Size of Search Space (cont.) Linear Join Tree Bushy Join Tree R4 R3 R2 R3 R4 R1 • Restricting the shape of the join tree • Consider only linear trees, ignore bushy ones • Linear tree –at least one operand of each operator node is a base relation • Bushy tree – more general and may have operators with no base relations as operands (i.e., both operands are intermediate relations) R2 R1
Search Strategy R4 R3 R3 R2 R1 • How to move in the search space? • Deterministic and randomized • Deterministic • Starting from base relations, joining one more relation at each step until complete plans are obtained • Dynamic programming builds all possible plans first, breadth-first, before it chooses the “best” plan • the most popular search strategy • Greedyalgorithm builds only one plan, depth-first R2 R2 R1 R1
Search Strategy (cont.) R3 R2 R2 R1 R3 R1 • Randomized • Trade optimization time for execution time • Better when > 5-6 relations • Do not guarantee the best solution is obtained, but avoid the high cost of optimization in terms of memory and time • Search for optimalities around a particular starting point • By iterative improvement and simulated annealing
Search Strategy (cont.) • First, one or more start plans are built by a greedy strategy • Then, the algorithm tries to improve the start plan by visiting its neighbors. A neighbor is obtained by applying a random transformation to a plan. • e.g., exchanging two randomly chosen operand relations of the plan.
Cost Functions • Total time • the sum of all time (also referred to as cost) components • Response Time • the elapsed time from the initiation to the completion of the query
Total Cost Summation of all cost factors Total-cost = CPU cost + I/O cost + communication cost CPU cost = unit instruction cost * no. of instructions I/O cost = unit disk I/O cost * no. of I/O’s communication cost = message initiation + transmission
Total CostFactors • Wide area network • Message initiation and transmission costs high • Local processing cost is low (fast mainframes or minicomputers) • Local area network • Communication and local processing costs are more or less equal. • Ratio = 1:1.6
Response Time Response time = CPU time + I/O time + communication time CPU time = unit instruction time * no. of sequential instructions I/O time = unit I/O time * no. of. I/Os communication time = unit message initiation time * no. of sequential messages + no. of sequential bytes Elapsed time between the initiation and the completion of a query
Example Total time = 2 ∗ message initialization time + unit transmission time ∗ (x+y) Response time = max {time to send x from 1 to 3, time to send y from 2 to 3} time to send x from 1 to 3 = message initialization time + unit transmission time ∗ x time to send y from 2 to 3 = message initialization time + unit transmission time ∗ y Assume that only the communication cost is considered
Optimization Statistics • Primary cost factor: size of intermediate relations • The size of the intermediate relations produced during the execution facilitates the selection of the execution strategy • This is useful in selecting an execution strategy that reduces data transfer • The sizes of intermediate relations need to be estimated based on cardinalities of relations and lengths of attributes • More precise more costly to maintain
Optimization Statistics (cont.) • R [A1, A2,..., An] fragmented as R1,R2,…, Rn • The statistical data collected typically are • len(Ai), length of attribute Aiin bytes • min(Ai) and max(Ai) value for ordered domains • card(dom(Ai)), unique values in dom(Ai) • Number of tuples in each fragment card(Rj) • , the number of distinct values of Aiin fragment Rj • size(R) = card(R)*length(R)
Optimization Statistics (cont.) • Selectivity factor of each operation for relations • The join selectivity factor for R and S • a real value between 0 and 1
Intermediate Relation Size Selection
Intermediate Relation Size (cont.) the number of distinct values of A if A is a single attribute, or card(R) if A contains the key of R. Otherwise, it’s difficult. Projection
Intermediate Relation Size (cont.) • Union Upper bound: Lower bound: • Set Difference Upper bound: Lower bound: 0 Cartesian product
Intermediate Relation Size (cont.) • Join • No general way for its calculation. Some systems use the upper bound of card(R*S) instead. Some estimations can be used for simple cases. • Special case: A is a key of R and B is a foreign key of S • More general:
Intermediate Relation Sizes (cont.) card (RAS) = SF (S.A) * card(R) SF (RAS) = SF (S.A) = Semijoin where
Centralized Query Optimization Two examples showing the techniques INGRES – dynamic optimization, interpretive System R – static optimization based on exhaustive search
INGRES Language: QUEL QUEL Language - a tuple calculus language Example: rangeof e is EMPrangeof g is ASG rangeof j is PROJ retrieve e.ENAME where e.ENO=g.ENO and j.PNO=g.PNO and j.PNAME=”CAD/CAM” Note: e, g, and j are calledvariables
INGRES Language: QUEL (cont.) One-variable query Queries containing a single variable. Multivariable query Queries containing more than one variable. QUEL can be equally translated into SQL. So we just use SQL for convenience.
INGRES – General Strategy • Decompose a multivariable query into a sequence of mono-variable queries with a common variable • Process each by an one variable query processor • Choose an initial execution plan (heuristics) • Order the rest by considering intermediate relation sizes • No statistical information is maintained.
INGRES - Decomposition • Replace an n variable query q by a series of queries , where qiuses the result of qi-1. • Detachment • Query q decomposed into q’q’’, where q’ and q’’ have a common variable which is the result of q’ • Tuple substitution • Replace the value of each tuple with actual values and simplify the query
INGRES – Detachment q: SELECT V2.A2, V3.A3, …, Vn.An FROM R1 V1, R2 V2, …, Rn Vn WHERE P1(V1.A1)AND P2(V1.A1, V2.A2, …, Vn.An) Note:P1(V1.A1)is an one-variable predicate, indicating a chance for optimization, i.e. to execute first expressed in following query.
INGRES – Detachment (cont.) q: SELECT V2.A2, V3.A3, …, Vn.An FROM R1 V1, R2 V2, …, Rn Vn WHERE P1(V1.A1)AND P2(V1.A1, V2.A2, …, Vn.An) q’ - one variable query generated by the single variable predicate P1: SELECT V1.A1 INTO R1’ FROM R1 V1 WHERE P1(V1.A1) q’’ - in q, use R1’ to replace R1 and eliminate P1: SELECT V2.A2, V3.A3, …, Vn.An FROM R1’ V1, R2 V2, …, Rn Vn WHERE P2(V1.A1, …, Vn.An)
INGRES – Detachment (cont.) • Note • Query q is decomposed into q’ q’’ • It is an optimized sequence of query execution
INGRES – Detachment Example Original query q1 SELECTE.ENAME FROM EMP E, ASG G, PROJ J WHERE E.ENO=G.ENO AND J.PNO=G.PNO AND J.PNAME=“CAD/CAM” q1 can be decomposed into q11q12q13
INGRES – Detachment Example (cont.) • q11 and q’ such that q =q11q’ • q11: • SELECT J.PNO INTO JVAR • FROM PROJ J • WHERE PNAME=“CAD/CAM” • q’: • SELECTE.ENAME • FROMEMP E, ASG G, JVAR • WHERE E.ENO=G.ENO • ANDG.PNO=JVAR.PNO First use the one variable predicate to get
INGRES – Detachment Example (cont.) SELECTG.ENO INTOGVAR FROM ASG G, JVAR WHERE G.PNO=JVAR.PNO SELECT E.ENAME FROM EMP E,GVAR WHERE E.ENO=GVAR.ENO q12 q13 q11 is a mono-variable query q12 and q13 are subject to tuple substitution Then q’is further decomposed into q12q13
Tuple Substitution q131 SELECTEMP.ENAME FROM EMP WHERE EMP.ENO = “E1” SELECTEMP.ENAME FROM EMP WHERE EMP.ENO = “E2” q132 Assume GVAR has two tuples only: <E1> and <E2>, then q13 becomes:
System R • Static query optimization based on exhaustive search of the solution space • Simple (i.e., mono-relation) queries are executed according to the best access path • Execute joins • Determine the possible ordering of joins • Determine the cost of each ordering • Choose the join ordering with minimal cost
System R Algorithm • For joins, two join methods are considered: • Nested loops for each tuple of external relation (cardinality n1) for each tuple of internal relation (cardinality n2) join two tuples if the join predicate is true end end • Complexity: n1*n2 • Merge join • Sort relations • Merge relations • Complexity: n1+n2 if relations are previously sorted and equijoin
System R Algorithm • Hash join • Assume hc is the complexity of the hash table creation, and hm is the complexity of the hash match function. • The complexity of the Hash join is O(N*hc + M*hm + J), where N is the smaller data set, M is the larger data set, and J is a complexity addition for the dynamic calculation and creation of the hash function.
PROJ ASG EMP System R Algorithm - Example Find names of employees working on the CAD/CAM project. • Assume • EMP has an index on ENO • ASG has an index on PNO • PROJ has an index on PNO and an index on PNAME ENO PNO
System R Example (cont.) • Choose the best access paths to each relation • EMP: sequential scan (no selection on EMP) • ASG: sequential scan (no selection on ASG) • PROJ: index on PNAME (there is a selection on PROJ based on PNAME) • Determine the best join ordering • EMP ASG PROJ • ASG PROJ EMP • PROJ ASG EMP • ASG EMP PROJ • EMP PROJ ASG • PROJ EMP ASG Select the best ordering based on the join costs evaluated according to the two join methods
EMP ASG ASG PROJ PROJ ASG (PROJ ASG) EMP (PROJ ASG) EMP (ASG EMP) PROJ (ASG EMP) PROJ System R Example (cont.) alternative joins • Best total join order is one of PROJ EMP ASG ASG EMP PROJ × EMP EMP × PROJ
System R Example (cont.) • (PROJ ASG) EMP has a useful index on the select attribute and direct access to the join attributes of ASG and EMP. • Final plan: • select PROJ using index on PNAME • then join with ASG using index on PNO • then join with EMP using index on ENO
Join Ordering in Fragment Queries • Join ordering is important in centralized DB, and is more important in distributed DB. • Assumptions necessary to state the main issues • Fragments and relations are indistinguishable; • Local processing cost is omitted; • Relations are transferred in one-set-at-a-time mode; • Cost to transfer data to produce the final result at the result site is omitted
Join Ordering in Fragment Queries (cont.) • Join ordering • Distributed INGRES • System R* • Semijoin ordering • SDD-1
Join Ordering • Consider two relations only • R ⋈S • Transfer the smaller size • Multiple relations more difficult because too many alternatives • Compute the cost of all alternatives and select the best one • Necessary to compute the size of intermediate relations which is difficult. • Use heuristics
Join Ordering - Example Consider:PROJ ⋈PNOASG ⋈ENOEMP